213 - Faking It
217 - South China Sea
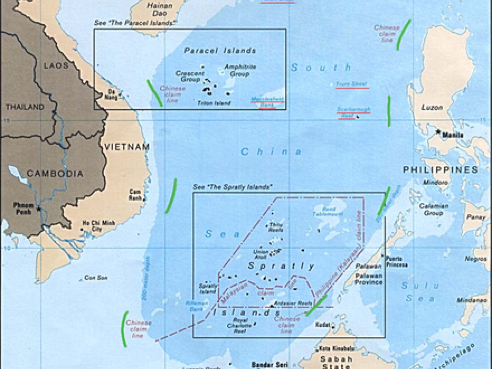
There is a rumbling occasionally reported in the press I so often denigrate reflecting an ongoing dispute over the ‘ownership’ of the South China Sea.
Way back in 1947, which is before the creation of the People’s Republic, there was a map, the eleven dash line (shown, black & white). This reflected a claim made (as far as I can tell, internally) and was subsequently taught in school, which means that there is a vast number of people who have been told “this is ours”.
The South China Sea is bordered by China, Taiwan, the Philippines, Malaysia (Borneo, Sumatra and the peninsula), Brunei, Indonesia, Singapore, perhaps Cambodia (it depends how you define the space) and Vietnam. Along its bor-ders are the straits of Taiwan, Malacca and Karimata. One third of the world’s shipping crosses some part of this space.
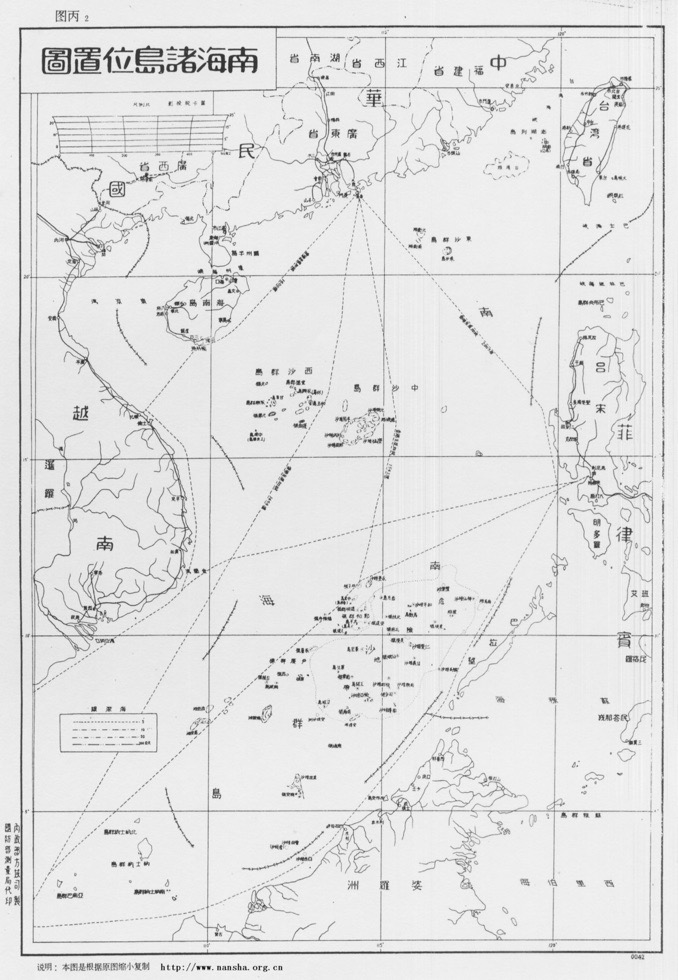
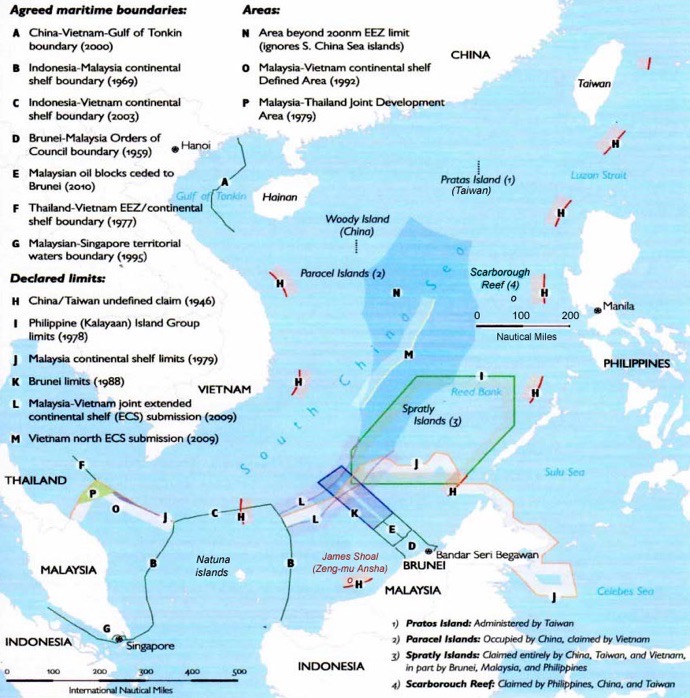
A domestic dispute as to the location of the Spratly islands revealed that we were both wrong and they are located far further south than either of us thought. Bearing in mind that the boss went through the Chinese geography course at school, she might be expected to know already about the nine (or ten or eleven) dash line. Here is a more usable map that allows one to recognise names from other sources.
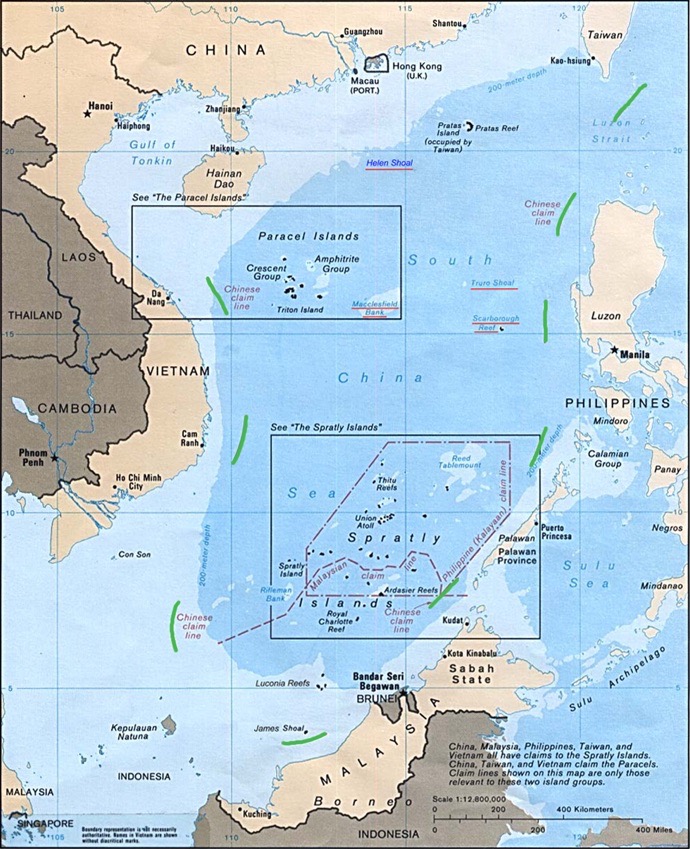
It shows the ‘nine dash line’ and you might spend a little time looking for the differences.
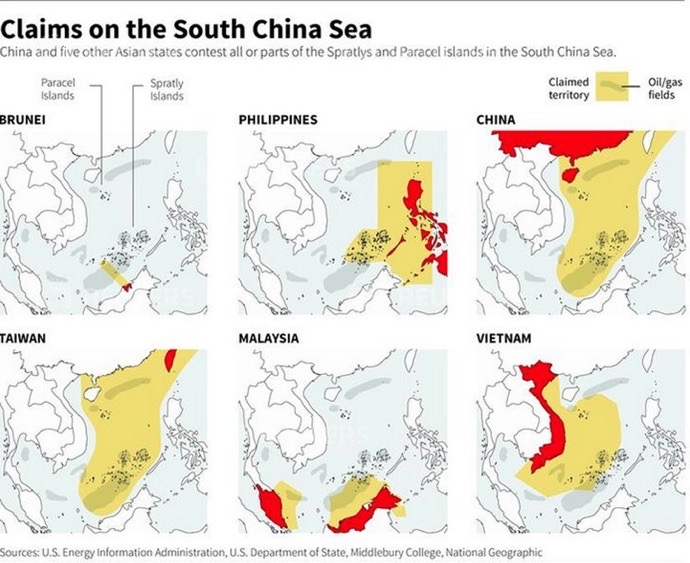
The current issue is that these maps are the substance of the current claim by China to ownership of this tract (the ‘cow’s tongue’) of sea. Most especially the sea bottom, since there is a suggestion that we might expect there to be oil below. Since the sea is not particularly deep [evidence?] we might expect there to be ongoing exploration for oil deposits and, the moment there is evidence of volumes, we can expect the level of international disagreement to ramp up sharply.
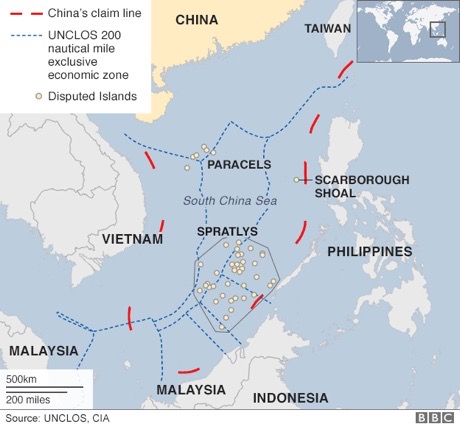
China has been remiss in making claims under international law for this area1. In effect it has been rejecting that law. Meanwhile, the attrac-tion of available oil in an otherwise oil-starved region is encouraging several nations to be frantically building on the tiny reefs that poke above the sea surface.2
The low estimate of volume equates to what Norway has left under the north Sea, which is about half of what is left in total, where we have extracted more than half (the cheaper half). See Peak Oil.
Jeremy Maxie, writing in Forbes, tells us that this territorial dispute might well be as much about fishing as oil and gas, but underlying this is one of sovereignty. He says we have the argument back to front: China is not asserting expansive territorial claims and risking military confrontation with its neighbours (and potentially the United States) just to gain access and control of unproven oil and gas resources; instead, the development of offshore oil and gas resources is contested because it evokes sovereignty. I say this may be chicken and egg, but I do not entirely understand what this means nor how we should use that to understand China’s attitude.
There is dispute and confusion how much oil and gas there is in the South China Sea. I found estimates of 2 and 200 billion barrels easily. Quoting Forbes and Maxie: the U.S. Energy Information Agency (EIA) the South China Sea is thought to hold 11 billion barrels of oil and 190 trillion cubic feet of natural gas (Tcf) including both proven (P90) and possible (P50) reserves. These high-end estimates are the most widely quoted, frequently without the caveat that it includes probable reserves which only have a 50% certainty of being recovered under existing economic and technological conditions. This misrepresentation adds to the misconceptions that drives the resource conflict narrative. Longer quote in footnote 3. In contrast, CNOOC claims that the SCS holds an estimated undiscovered 125 billion barrels of oil and 500 Tcf of natural gas.
To put these numbers in context, China’s annual demand is around 4 billion barrels; remember (Peak Oil) that it is the first half that is relatively easy (cheap) to recover, so the latter half is obviously expensive and therefore, as with closed mines, one must wait until the price goes up enough to make extraction of the latter half economically sensible.
One topic of agreement is that the SCS is mostly ‘gas-prone’, meaning there’s way more of that. China’s demand in 2015 was just under 7Tcf4. Quoting Mr Maxie again, this means that the total projected SCS gas reserve would meet 2015’s gas demand in China alone for 30 years.
I thought the SCS was shallow, but it is not; at 400-1200 m this is what the oil industry calls deep-water.
This mostly blue map goes some way to explaining which claims have any degree of agreement. It informs external statements as to ‘ownership’ of putative volumes of hydrocarbons. From the wikipedia entry.
From a different perspective, one I collected from Australia, we might look at the disruption that active dispute (warships in some aggressive mode) would have upon trade across the Pacific. This is mostly because of the traffic thro-ugh the straits of Malacca (Moluca, Meluka, etc).
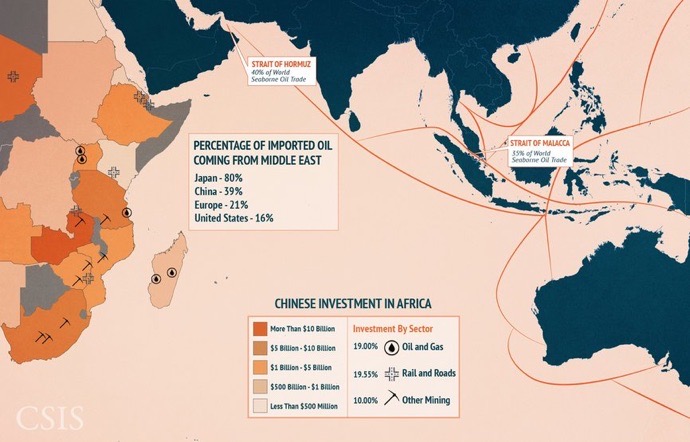
The article that goes with this makes interesting reading.
What is actually occurring in the SCS is that there is rapid building taking place. You can see quite a bit of this by playing with Google Earth. Several countries bordering the SCS (plus US interests, I suspect) have built processing or holding units for hydrocarbon extraction, various military installations and some runways. These last are actually the easiest to find for yourself.
:
In summary, I cannot separate the sovereignty issue from the pursuit of oil and gas, though maybe you can, in which case please explain that to me. To China alone the acquisition of the bulk of the anticipated field represents a gain similar to that of the north sea fields to the UK.
DJS 20170124
Happy birthday Hoagy
...and on the 25th, the Times had a lengthy article on the same topic.
wikipedia entry
https://en.wikipedia.org/wiki/Nine-Dash_Line
https://en.wikipedia.org/wiki/Territorial_disputes_in_the_South_China_Sea
http://www.forbes.com/sites/timdaiss/2016/05/22/why-the-south-china-sea-has-more-oil-than-you-think/#b9ff6e43a3f8
http://www.businessinsider.com.au/why-the-south-china-sea-is-so-crucial-2015-2
Pictures of establishments in the SCS. I googled (images) for South China Sea installations, construction, airstrips.


1 Ruling at the Hague in dispute between the Philippines and China (the PRC) that China has no basis for ‘historic rights’. BBC link
2 A USGS survey of 1993 suggested there is a lot of oil down there. See Forbes. Estimates vary between 28 and 213 billion barrels, which is a large range. For context, the biggest in the north Sea, Clair field, is 8 billion barrels. 29 billion barrels is the same as what Norway has left under the North Sea, itself about half of what is left.
1 tonne of crude oil is 7.5 barrels
North Sea oil/gas is half gone: of what is left, Norway’s bit contains about half of that. Norway’s oil reserve at 2007 was 29 billion barrels.
3 Maxie said in Forbes: Estimates of oil and gas reserves vary since the SCS remains mostly under-explored with the majority of unproven reserves located in offshore deep-water areas. According to the U.S. Energy Information Agency (EIA) the South China Sea is thought to hold 11 billion barrels of oil and 190 trillion cubic feet of natural gas (Tcf) including both proven (P90) and possible (P50) reserves. These high-end estimates are the most widely quoted, frequently without the caveat that it includes probable reserves which only have a 50% certainty of being recovered under existing economic and technological conditions. This misrepresentation adds to the misconceptions that drives the resource conflict narrative.
The EIA South China Sea report estimates Vietnam’s reserves at 3.0 billion barrels of liquids and 20 Tcf of natural gas, while China’s are at 1.3 billion barrels of liquids and 15 Tcf of natural gas. The Philippines’ share of reserves is only 0.2 billion barrels of liquids and 4.0 Tcf of natural gas. Malaysia has the biggest share, with 5.0 billion barrels of liquids and 80 Tcf natural gas, while Indonesia hold 55 Tcf of natural gas but only 0.3 billion barrels of liquids.
In contrast, CNOOC claims that the SCS holds an estimated undiscovered 125 billion barrels of oil and 500 Tcf of natural gas. These numbers are likely inflated for political purposes, as the consultancy Wood Mackenzie estimates that the SCS only holds about 2.5 billion barrels of oil equivalent. The focusing on estimated reserves of oil or natural gas is also misleading, as global average recovery rates for “oil in place” is only about 35% with technical limits estimated at 60-70% with enhanced oil recovery techniques.
4 Tcf, Trillions of cubic feet. Now there’s a stupid unit. 1 TCF = 28.3 billion cu. metres, meaning 2.83x10¹⁰m3, or 28.3 km3.

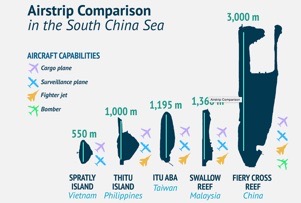
Islands I can name with construction on them include:
airstrips: Fiery Cross Reef, Swallow reef, Itu Aba, Thtu Island, Spratly Island, see map
Woody Island, Mischief Reef. Ayungin, Subi Reef, Johnson South Reef, Cuarteron Reef, Hughes reef,
There’s a display from the NYT worth watching. I found it some work to discover how to move it on to the next frame. A flick of a finger along (not across) my mouse proved the best action.
Response - I got one!!
Steve, who oscillates between the US and China, and who is a declared nihilist, said, 25/1/17:
South China Sea. Here is what is going on. Around 2002, the PRC military academy published a book on the projection of power. They looked at the world from 1600 and noted a succession of world hegemons: Portugal, Holland, Spain, France, England. They asked: why did each of these empire builders ultimately fail? The answer is that they spent so much money maintaining their empire that they ultimately bankrupted themselves.
Then they took up the question of China vs. the U.S. First, they concluded that China will never be a hegemon because China will never be wealthy enough to fund the enterprise. It is interesting that their logic was: in the modern world, for a nation to become rich, it must become a liberal democracy on the EU/North American model. China will never do that, so China will never acquire the wealth.
But what to do about the U.S.? The policy recommendation was to goad the U.S. into seeing China and a threat and through this to induce the U.S. into excessive spending on projection of power: armaments, troops and related. In connection with, induce the U.S. to hollow out domestic infrastructure spending while at the same time creating a police state atmosphere of constant fear. Based on the history of the other world hegemons, this should then ultimately bankrupt the U.S., removing from the world stage as a hegemon.
However, under this policy, China will NOT seek to replace the U.S. as the next hegemon. The fall of the U.S as hegemon will introduce a new system of a truly multi-polar world. Under this system, each regional hegemon will be constrained by its economic ability to project its power within its region.
So the South China Sea is part of a plan aimed at the U.S. So far, the plan is working well.
216 - Damned lies and statistics
Given that our society is now declared to be ‘post-truth’, I have been wondering why that is. One aspect of the problem is the inability to process statistics. Yet again, as soon as I have had the idea to write, the Guardian Long Read1 strikes at the same matter with remarkable synchronicity. This time the paper got there first, by about a week, but I discovered that after I’d written much of what I have to say. This effort was then edited to reflect not so much the Long Read’s content but the comments that followed it.
I have complained on these pages far too often that the press fails us as a source of information. It is not as bad as the visual media, but it is still failing to, for the most part, explain to those of us who really want to know about a topic.
Taking any so-called statistics as an example, I used to say at the start of any course in Stats (and therefore the start of descriptive stats) that there are two measures, location and spread. By pairing these I hoped that students would recognise the need for both, but I didn’t labour that and maybe I should have, because that lies at the root of the current observed failure to comprehend numbers. Hard on the heels of that two-part description is that statistics are, in general, used to condense a mountain of data into a (small) group of numbers that describe the data (properties of the data or its distribution).
What goes wrong, especially when such folk as politicians and members of the press are included, comes in several parts:
- (i)the perception that the audience is not only stupid but completely unable to comprehend numbers reduces all use of figures to less than the minimum necessary. This is not at all helped when the quoted numbers are only transmitted orally (and so received aurally). Many of us do genuinely have difficulty holding such numbers in our head for long enough to process them helpfully.
- (ii) the numbers themselves are often, because of (i), delivered without the many caveats that indicate exactly what was measured, processed, etc and that includes access to the original data.
- (iii) most of the time what is suppled is one of the measures of location, probably called ‘average’, when we know (‘cos we’ve all done GCSE Maths at some level) that there are three averages. Some of us even know that they can be quite well separated, such as the median and mean of an asymmetric distribution (such as personal income across the nation)4. Most of us once knew—and if challenged to think would remember—that a median is the middle number (when in order), so we understand that half of the population (of the data) is below the median and half above. So, for example, we actually understand that half of the population of the nation has pay below the national average; if they didn’t, it wouldn’t be a median. For that income distribution, indeed, we might expect the mode to be at or close to the minimum wage and for the mean to be embarrassingly high (ambition for A-level students might include eventually having pay above the national mean!!).
- (iv) Statistics applied to something large like a nation are unlikely to explore local effects. This means that the general comment can all too easily conflict with local (personal) knowledge, so, because the ancillary descriptors are missing, makes the audience disagree with the numbers quoted. Of course you do, unless you happen to live in a place that accidentally models the average for this particular issue.
We have several sub-issues, one of which is that people expressing opinion, especially people being paid to move opinion in a particular direction, will never agree with the stats used by the ‘opposition’. Their first objective is to discredit the numbers. There are many ways to do this and they are the subject of the school subject Critical Thinking (but only where that is accurately titled, not Use of English in disguise, though that too is a good subject to follow).
Looking for examples to demonstrate at least some of these issues, I found myself casting back to the Brexit referendum, its reporting and the failure of communication of numbers. Take, for example, the perception that there are many European migrant workers in Britain, where it is those from Poland who were singled out for unfair and unwarranted vilification.
Leaving aside how it is that they are identified and isolated as a community, it should be noted that to understand any figures for employment as quoted by the ONI we need to understand what employment is. Easy, you say, someone gets paid for doing work: Try these questions:
(i) How much work would you do to be included in the stats as being employed?
- (ii)How much work do you need to have done to not need government support?
- (iii) If a PhD-holder is on minimum wage is that not also underemployment?
- (iv) Are those who are retired in the potential workforce?
- (v)When does a migrant worker qualify for inclusion in the workforce?
Notice the difference between being unemployed or underemployed. Notice how thoroughly one needs to understand what employment is or is not before being able to use some statistics to support an argument.
As for the use of statistics in political discussion, meaning political in its widest sense and especially when intending to discuss such things in front of an audience, then if it was my show to run, there would be a previous discussion in which the parties agreed upon common facts3 . Then we might precede argument with a dissertation from an apparently independent source such as perhaps the broadcaster. What I find completely useless is when the initial content is already filtered through some political bias. I find myself in frequent agreement with, for example, Nigel Farage and Boris Johnson. By which I mean, if I was in their position I would quite probably say something similar. The reaction(s) that the press as a whole delight in feeding off is, from my perspective, useless froth when I would far prefer that the press made at least some attempt to discover some news of relevance. For example, we have a dearth of certain vegetables, where I noticed the lack of broccoli but not that of courgettes. I see this week there is no blue-topped milk in (two different) supermarkets – now that, to me seems worthy of proper investigation, including explaining where these foods come from, what the problems are, where else we might find such or what we might substitute for it. I’d even say this justifies lead in the national news. But no, this week we have Boris complaining that the Europeans wish to beat us up in the style of a sit-com, for which he is accused of calling them Nazis (he didn’t use the word at all) and page after page of ‘reaction’. Not even worth a teacup to put the storm in.
DJS 20170124
I discuss much the same matters from a different perspective in several other essays:
Thanks to Adam Stonehouse for the introduction to Jonathan Pie, to whom I may need to put links where we coincide on topics at which to rant. Wikipedia entry. For those outside Britain, you need to remember just how extreme British humour can be when measured against your own national humour. Americans may prefer Bill Maher.
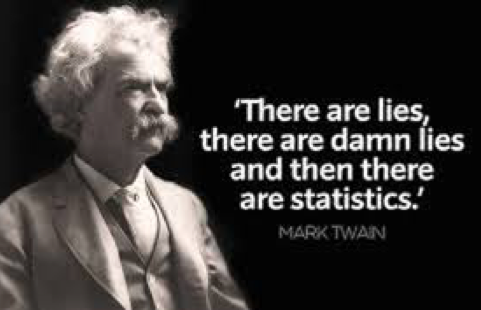
top pic from izquotes.com. Quote is from either or both of Mark Twain and Benjamin Disraeli. Twain said he was attributing the lines to Disraeli (not quoting, one notes). The Wikilpedia entry (linked) attempts a explanation.
1The relevant Long Read really was a read (not a podcast and the Guardian really needs to use an accurate word for the listening process), found here:
https://www.theguardian.com/politics/2017/jan/19/crisis-of-statistics-big-data-democracy By William Davies, 19/01/2017. I noticed in May that this has been rectified, but I doubt it was me that caused the change.
2 Actually, while the topic was mentioned early on, the article—which, when I scanned it at speed, left me with the impression it was rich in detail—left me with no quotable examples at all.
3 And I hope these would not be ‘facts’. At the least it would allow for a statement of common ground, but I’d like to work from a basis of agreed substance. Nothing makes me turn off the tv and radio faster than an opening disagreement. Contrarily, if the first respondent (the second speaker) starts off by agreeing to some of the declared content and then chooses to define where opinions differ, I am gripped, for that to me is what politics should be about – what direction we want to choose. This perhaps is why I watch so little tv and why the radio is mostly off. At least in the paper I can clearly identify comment; what I want but am denied is the links to sources, as I have written repeatedly; hopefully a complaint of which I am myself found not guilty.
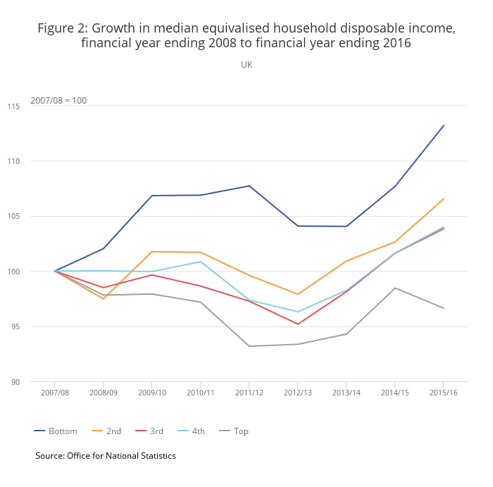
4 UK median household disposable income 2103/4 £26300, 2015 £27600, suitable source Note that gross pay will be dramatically higher, add back income tax, nat Ins, council tax; that this is per household, not per person. The ONS source separates the retired (but they mean collecting state pension); separates the different quintiles of the distribution (e.g the bottom quintile’s median came up and the top came down, both of which is deemed to be good). See Fig 2 here.
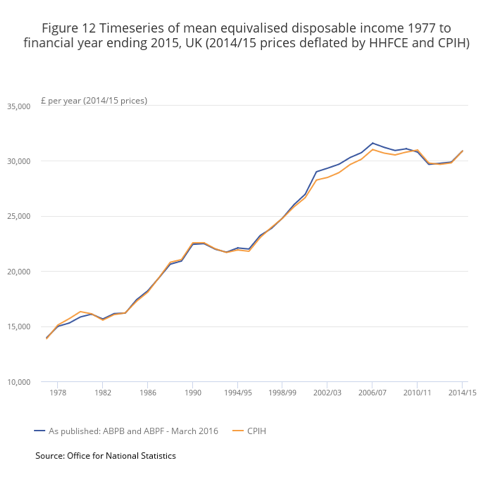
There is an interesting gap between GDP per person and the higher disposable income; a measure of well-being is the gap between GDP per head and net national disposable income [NNDI] per head. The mean is well hidden, probably because it is a much larger number and the ONI doesn’t want politicians shouting it around. Half the population is of course below the median, but an awful lot more are below the mean and since the press thinks anyone below the average is a cause for campaigning (merely emphasising how much they do not understand about numbers), we don’t want a majority thinking they’re badly done by.
The 2015 figure (Fig 12, below) is just under £31,000; mean equivalised disposable income).
215 - Commuting
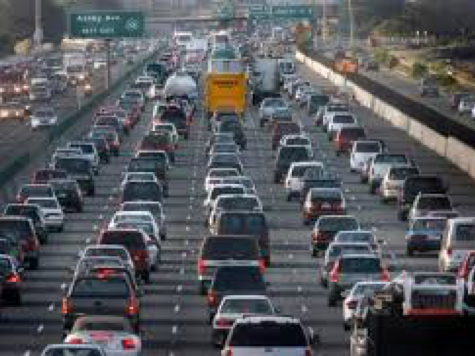
The average driver spends two hours in the car each day commuting to and from work, school and other destinations. source. Average where? I can believe that the average American family spends two hours per day delivering adults and children to school and work. Is it commuting to go to other destinations than work? No; the verb means to go to/from work.
Following on from 213 on email issues I write here about usable time. What prompted this was reading about the progress to autonomous cars, cars that drive themselves a lot of the time. This should change a car drive into an experience more akin to sitting in the most expensive seats on a train; quiet, peaceful, radio or music on tap and as the mood takes you, the ability to work (or reflect on the day ahead) – time that you can choose to use or not use1.
How much time do we spend commuting? Research in 2015 by the TUC reported in the Guardian says it is rising. The number of [UK] people commuting for more than three hours per day has risen from 500,000 in 2005 to 880,000 in 2015. Average commute has risen from 2004 52 mins to 2015 55 mins. The average EU commute is 37.5 mins per day [independent]. The Mail says 98 minutes. As ever, we have numbers that conflict2.
The TUC report3 points to ONS data (a wonderful resource). There is a regular output of ‘average home to work travel time’, which rapidly yields data that disagrees, with a maximum declared average of 48 minutes (in Haringey). Which does not mean that either is wrong, but does say that there is a very large number of people who spend a lot less than two hours on the daily commute. ONS figures for Oct 2016 say 23.2 million people work full-time, 8.56 million part-time, 1.62 million unemployed (4.8%, a low), and tell you the labour force is 33.38 million4.
Of course, despite essay 213, we know what is going to happen when we have driverless cars. Even more time will be spent mindlessly prodding at the mobile, pointless comments on social media, each of us kidding ourselves that this is essential, pointful productive activity. Unless you are already some sort of famous person upon whom a following rely and their livelihoods depend upon you providing output, no it isn’t. Really.
DJS 20170106
top pic on googling ‘commuting’; https://ricardobarroselt.files.wordpress.com/2016/10/commute.jpg
1 Autonomous car stages, with Nissan (California) predictions
1 autonomous drive on single lanes
2 autonomous drive for multilane highway driving with lane changes (2018)
3 is autonomous city driving (around 2020)
4 completely autonomous driving
2 OnePoll asked 600 commuters (rail commuters?). I found the OnePoll website very clumsy. Searching for ‘commuting’ told me about trips into space, searching on ‘travel time’ gave me that and loads of studies with no relevance to commuting (nor to time spent travelling). I did not find the report on which the reporting was based.
3 TUC report data based on surveys in 2004 and 2014
Daily commute up from 52.5 to 56.3 minutes (7% rise)
2 hours or more from 1.740 to 2.995 million people (72% rise)
3 hours or more from 502 to 880 thousand people (75% rise)
4 Suppose the work force is 30 million, that daily travel times include 2 million for 2 hours, 1 million for 3 hours and that the average travel time is 40 minutes. What then is the average travel time for those who travel less than two hours? I get 27 minutes. If 3 million work at home, then the majority group mean goes over 30 minutes.
If this was a normal distribution with the median at 1 we’d have 20% outside [0+,2]; so 45% travel an hour or more, 40% between 1 and 2 hours; 45% an hour or less including 10% at zero time.
I will continue to look for evidence describing the distribution. This may turn into a page of maths elsewhere on the site.
214 - Inbox Zero

Yet again the Guardian’s Long Read has sparked a response from me. Not yet enough to subscribe, but I’m steadily closer. This time it is Oliver Burkeman on the topic of email and how we do (or don’t) handle it. I quote a chunk so as to set the scene:
The eternal human struggle to live meaningfully in the face of inevitable death entered its newest phase one Monday in the summer of 2007, when employees of Google gathered to hear a talk by a writer and self-avowed geek named Merlin Mann. Their biggest professional problem was email, the digital blight that was colonising more and more of their hours, squeezing out time for more important work, or for having a life. And Mann, a rising star of the “personal productivity” movement, seemed like he might have found the answer.
He called his system “Inbox Zero” [link inserted], and the basic idea was simple enough. Most of us get into bad habits with email: we check our messages every few minutes, read them and feel vaguely stressed about them, but take little or no action, so they pile up into an even more stress-inducing heap. Instead, Mann advised his audience that day at Google’s Silicon Valley campus, every time you visit your inbox, you should systematically “process to zero”. Clarify the action each message requires – a reply, an entry on your to-do list, or just filing it away. Perform that action. Repeat until no emails remain. Then close your inbox, and get on with living.
Which, it seems to me, says that the task of dealing with mail is to be given some attention, wholly rather than partially. I covered many of my issues with this sort of thing in explaining why it is I hate the phone. In brief, it is because the phone interrupts whatever it is you are doing. worse, there is at least a partial assumption on the part of the caller that you have nothing better to do than chat on their topic of choice. An email resolves this issue, allowing one to deal with it when ready – and to do so completely.
But all those who are forever twitching at their phones have somehow decided that the email is far more like the phone call, requiring an instant response. This is NOT what it is for and everyone who treats email like that is in error. Both those that send email when an instant response is needed (wrong medium) and those who see the immediacy as important (again, wrong medium and, probably the wrong sort of response). Mail, being written and so taken as record, needs to be quite a bit more complete that the spoken word. No doubt this is exactly why some businesses would far rather use oral methods, committing the minimum possible to written forms. Fair enough and appropriate in context. Mail should therefore include attempts at completeness and at non-ambiguity. This may make it longer than you are used to writing.
However, having experimented at length with this while working abroad, I can now claim that, for the most part, the written form is actually quicker in reaching positive results than the oral methods. Mostly this is because people are actually pretty slow at thinking and far faster at working the mouth, so oral meetings with zero preparation are strongly ineffective. Unless, of course, you consider it important to persuade people into your line of thinking. I far prefer people to come up with their own thinking, though I’m not above a little steering if i think it will help. That became the distinction between what I thought appropriate for a meeting and for an email. I used email for factual content, which would include what we might call office history, minutes, recorded opinion and so on. Reaching collective decisions calls for oral meetings but the email prepares the ground so as little as possible is new. then opinions can be aired with less of the change that occurs with the first expressed opinion (because they have arrived at an opinion earlier). If you like being surrounded by yes-men, you won’t do that. I have long felt that a business will work better if all opinions are heard, voiced and appreciated. then when a business decision is reached it may reflect consensus but it does recognise that the other opinions have been heard and it just might explain why the action is taken (and that the boss is taking responsibility for the result, so just perhaps the staff will support making it work).
Suggested routines:
• Mail is attended to at fixed times.
• Each mail is responded to, or moved to an equivalent to the Action list.
• Use colour, tags,, flags and labels as supplied by your emailer
• Put mail in files.
• Don’t be afraid to delete stuff.
Which, you might think, is a long way from how to treat an email. Yet it is the purpose of email that should be driving how we deal with it. Do you think email is somehow different from what paper mail was 50 years ago? If so, why is that?
When I was at college, back in the Stone Age, mail internal to the university would easily produce a reply in the same day and sometimes a second exchange. My grandmother expected letter mail to provide same day replies to local mail, e.g. an invitation to lunch tomorrow. Or in her case, golf.
We can use email as pretty immediate communication but the principle here is that the mail is dealt with at your convenience. In my world, if your response time is too quick, you haven’t got enough to do. Social media posts are already clearly different from email, but I wonder what it is that is served by this persistent insistent and near-continuous checking of phones. It seems to me that this advertises not having enough to do of any import or value. But then I felt the same when I was myself at school – the social elements were, to me, largely empty, vacuous meaningless exchanges that would be better served by some forethought. I feel the same when watching a lot of television and that is probably why I enjoy well scripted exchanges.
Perhaps, as the Guardian suggests, the issue at heart is to do with personal productivity or time management. I agree, but these are inherently personal issues to deal with unless and until they impact upon employment. I am against the use of social media while at work; I always felt that personal phone calls while at work were wrong (and for that lost time to be compensated); I have always felt that work time should be for exactly that, preferably productive work. If there is insufficient work to be productive, then more needs to be found (or go home).
For some, this is not a task management problem at all but a stress problem to alleviate. That is beyond me. Spot an issue and deal with it. If you can;t deal with it right now, put it in a place where you can deal with it. Worry is only concern that there is something you should have done; this demands resolution. I have seen occasions where the failure to find resolution is the source of stress and this too i do not understand.
It is clear to me that being too efficient, by which in this case I mean responding to mail quickly, may well generate more work. But dealing with mail does not have to be done immediately. I am of the opinion that if i decide to read a mail then I am accepting that I will deal with it, at least partially, at the time of reading. otherwise it is wiser by far to not read it.
There was a parallel situation when teaching: to encourage internal communication among busy people one had a pigeon-hole. Into this went all sorts of mail; external mail, internal mail, notes recording a phone call from outside, even occasionally, junk – equivalents to all the mail one now receives electronically. The usual habit was to go process this pigeon-holed stuff every time one went into the common room (or wherever the pigeon-holes were sited). But some of this demanded immediate attention, mostly because you were located beside the pigeon-holes at the time. The most irritating conversation started with “I’ve just put <thing> in your pigeon-hole”. So you want to discuss it blind? You want an answer now? You’re an important person who needs an ego massaging? You’re saying ‘Hurry up’? Or are you really saying no more than “I’ve done something today”? the equivalent is to write email and then get on the phone to say “I’ve sent you a mail”. Stupid, unproductive and (worse) dragging someone else down to the same level of non-productivity.
Which really amounts to a plea for people to use the appropriate medium for their messages, doesn’t it?
I have little use for chatter. I wonder why that is? Could it be that the content level is (too often) too low to justify attention? The extended family is often accused of moving the specific to the general or the abstract and for doing that (too) quickly. But what is the point of, for example, moaning about something unless you are prepared to do something about it? Which in many cases would be the response [“What are you going to do about it?”], although the verb might change to reflect possibility – and, at this point there is a conversation worth having; a problem is identified and exploration of responses is in hand. the classic one in the staff common room would be a moan about some child; until the moaner reached a point at which there was any contemplated action, this was not communication and could have equally well been held with a statue. Thus the common room worth being a member of had reached a point where the child-specific moan rapidly moved to a discussion of, perhaps (i) that child’s issues, IEP, recommended actions or (ii) that teacher’s issues with that lesson (or approach, or style (iii) some external event that caused friction between pupil and teacher. All of these are larger than the single issue but are more likely to produce resolution, particularly avoidance of a repeated event. that, to my way of thinking, is what a common room is for. It is also what productive communication is for.
Maybe that is the point?
DJS 20170105
top pic from focus ratings
While there is a lot written about time management, there is a growing consensus (a vague term indicating i found more than one person happy to write about it) that the more efficient you are, the more work there is for you to do. I suggest that the proverbial ‘busy person’ does indeed attract more work, from those who are working less efficiently indirectly and from those whose response to everything is simply to move it off their ‘desk’, perhaps merely by asking questions. This too is a recognised way of looking good while doing little. Which brings us, yet again back to the measures of success. What continues to bother me about all of this is that there is an implied lack of trust that the personnel involved have the interests of the company at heart. Far too much literature says i am a fool to even wish for this. Yet I say that is the role of the leadership and, in turn it is part of their role to find leaders. Which in turn suggests that the current enlightened attitudes that pursue more holistic goals are indeed onto something. When people enjoy their work they are productive; that then leaves management to wonder whether this production is useful. I continue to wonder why so many managers are paid huge sums of money for failing to manage. I suspect that the level at which politics comes into play is the same level at which job descriptions fail to match the behaviour of those employees. that may also be the point at which an individual can no longer do the jobs of those below. Further reading might include this as a stimulus.
I am convinced that continuous pressure drives out an ability to think. Occasional pressure strikes me as healthy, but so does the ability to reflect (rather than react). If we are terribly efficient we cannot react to change; in turn that suggests there is a cost to having flexibility, even to simply having flexibility available. Question then: do the ‘busy’ people you know exhibit an inability to reflect, too? If so, are they being busy so as to avoid having to think about other matters such as what they are doing with their lives? In the end, this individual problem is the same as the one in the workplace; the people problem is the same as the personnel one and the personal one. Which, I suggest, means that you might as well sort out your own life, for whatever strategies you adopt should apply just as well to work, too. If they do, then you have a life that is consistent in its behaviour and you might find this a source of happiness; If they don’t, you’re either being schizoid (not necessarily a bad thing) by compartmentalising your needs and wants – many people call this a job rather than a career. As the spectre of automation looms over us, we’re going to need to find more adaptable positions and wider skill sets so as to stay in productive employment.