213 - Faking It
222 - Diesel is Bad

Members of my day house at PMC used to laugh that I always started with a ‘me’ statement. I think I do that to locate the issue at hand. Recent press coverage, for all that it may well be a misrepresentation, tells me that I must in future buy a petrol engine, because diesels are bad. I have spent some time trying to find out what is going on here, since we have historically been told rather the opposite.
Bearing in mind that I have written at length on this general topic, essays 177, 162, 106, 104, among others on vehicles, I will attempt to restrict myself to the issues as perceived in Britain. Which appears to have made NOx the problem, not the fine particulate matter, PM2.5. As ever, the press both broadcast and paper goes for the headline over clarity. While each time i hear diesel being vilified we eventually hear ‘old’ attached to the descriptor (buried in the third paragraph or later, on hears the message repeatedly, diesel is bad. As I just did.
1 Diesel fuel contains more energy per litre than petrol and coupled with the fact that diesel engines are more efficient than petrol engines, diesel cars are more efficient to run. Diesel fuel contains no lead and emissions of the regulated pollutants (carbon monoxide, hydrocarbons and nitrogen oxides) are lower than those from petrol cars without a catalyst. ... When compared to petrol cars with a catalyst, diesels have higher emissions of NOx and much higher emissions of particulate matter.
So we have emissions issues, NOx, particulate matter, age, and a subsidiary task, to discover how bad one’s own vehicle is. I’m going to deal with that first, so as to set the scene.
Question, how bad is my car (or yours)?
I found a ‘car emissions calculator’3 designed to compare vehicles, so I put in the current car Audi Q3 and the previous car, Audi A3, both diesels, both running on ‘eco’ of the drive options. The A3 was the basic SE (lovely figures, horrid seats), the Q3 is very grand and expensive to run, by comparison not at all green. It is convenient to use these, too, because Audi is a member of the VW group, taken to task for cheating the testing systems. The webpage3 offers ‘real world and ‘official’ outputs, and I had as output:
AUDI Q3 44
Diesel - 1968cc (2 litre)
2.0 TDI quattro Sport 150PS - Manual 6-speed
OTR: £30,200
Diesel
SUV
CO2: 129 g/km
NOx/PMs: 69/0 mg/km
Euro Standard: 6
Official MPG (Comb): 57.6 MPG
Real MPG (Comb): 40.6 MPG

❯
AUDI A3 36
Diesel - 1598cc (1.6 litre)
1.6 TDI SE 116PS - Manual 6-speed
OTR: £22,215
Diesel
Small family
CO2: 106 g/km
NOx/PMs: 42/0 mg/km
Euro Standard: 6
Official MPG (Comb): 70.6 MPG
Real MPG (Comb): 49.7 MPG

Data type: Real World; Distance: 17,000 miles; Driving style: Economical (not Normal, not Aggressive)
NOx and PMs Q3: 13.82 kgs/year, 9.35 tailpipe, 2.21 Fuel, 2.27 vehicle CO2 6.02 tonnes
Total C O2 A3: 9.24 kgs/year, 5.69 tailpipe, 1.76 Fuel, 1.78 vehicle CO2 4.82 tonnes
Please note I got different figures the several times I did this; variability suspect, then, though it is as likely I chose different models in error. ‘Vehicle’ means emissions during manufacture, ‘fuel’ means emissions during fuel production. I consistently used (and do) ‘eco’ mode, 17000 miles per year. You need to do this for yourself.
Real world / Official
Q3 Real world : official: Fuel MPG 39.8 56.5 I’m getting about 45mpg across the life of the car, though 61 is the best I’ve managed on a long run. Emissions say 132 g’km for C02, euro Std 6, NGC ratings 59 GHG, 24 AQ
A3 Real world : official: Fuel MPG 49.7 70.6 I had about 63 across the time I owned it, 71 the best I achieved. Emissions say 106 g’km for C02, euro Std 6, NGC ratings 48 GHG, 18 AQ
Euro Std 6 means NOx 42 mg/km, PM: 0 mg’km. To investigate this, see the RAC site. Quoting bits from there: The EU has pointed out however that NOx emissions from road transport “have not been reduced as much as expected. Since emissions in real-life driving conditions are often higher than those measured during the approval test (in particular for diesel vehicles)”. As the UK government pointed out in December 2016, road transport still accounted for 34% of UK NOx emissions in 2015. The rate of reduction in atmospheric NOx has slowed down due to the increased contribution from diesel vehicles. Over the same time, average new car CO2 emissions have more than halved, going some way to meeting the target average of 95g/km by 2020.
The sixth and current incarnation of the Euro emissions standard was introduced on all new registrations in September 2015. For diesels, the permitted level of NOx has been slashed from 0.18g/km in Euro 5 to 0.08g/km. A focus on diesel NOx was the direct result of studies connecting these emissions with respiratory problems. To meet the new targets, some carmakers have introduced Selective Catalytic Reduction (SCR), in which a liquid-reductant agent is injected through a catalyst into the exhaust of a diesel vehicle. A chemical reaction converts the nitrogen oxide into harmless water and nitrogen, which are expelled through the exhaust pipe.
The standards have been steadily upgraded in Europe and I have no doubt this will cause a problem for Brexit negotiations – up to the point where we agree to agree with European standards on so many things, which will last until such time as we find things we intend to disagree over. I looked at Wikipedia for some help in understanding the terms. PN, for example, is a quantity of particles and I see 6x10¹¹ as being very high, although that is a marked drop from 1x10¹², and apparently quite a challenge to engine design7. In some cases, the concentrations in the exhaust to be recorded are considerably lower than the particle numbers in the ambient air.
Euro 6 sets NOx at 80 mg/km for diesels but 60 for petrol engines, Is this a measure of what is achievable? As NOx from transport amounted to 46% of the total for the EU in 20135 (though I wonder if transport meant just road), it has been pursued for more regulation. A different source6 said 15%, also quoting the commissioners.
Are diesels being demonised? See here for an example of the several I found.
Source2 tells us how wonderful diesel is as a fuel.
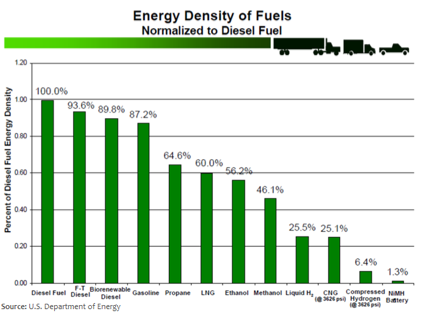
On emissions, they say this: Introduction of ultra-low sulphur diesel fuels for both on- and off-road applications is a central part of the clean diesel system designed to meet near zero emissions standards. With the introduction of lower sulphur diesel fuel came the ability to use a number of exhaust after-treatment options such as diesel particulate filters (DPF), exhaust gas recirculation (EGR), diesel oxidation catalysts (DOC), and selective catalyst reduction (SCR) with the use of diesel exhaust fluid (DEF) that can be sensitive to the sulphur levels in the fuel.
It goes on to encourage owners of ‘older diesels’ to retrofit their engines with these new technologies.
Particulate matter (see other essays too)
I found measures of ‘reduction in particulate matter’ of 94%, (or 98% in another source). 94% reduction means what, quite? Is that from 100 to 6%? Or from 194% to 100%?
Apparently,
it is
the wonderful one: diagram in evidence from 8. Which says that diesels have ‘fixed’ the particulate matter problem. Now we just have to apply that to all the engines we use.
NOx issue
Euro 4 emissions
standards (diesel)
2005
CO: 0.50g/km
HC + NOx: 0.30 g/km
NOx: 0.25 g/km
PM: 0.025g/km
But that doesn’t fix the NOx issue. The NO1 that comes out of engines rapidly becomes NO2 but then further converts to nasty acids and ozone. N2O reduces stratospheric ozone (which we consider good stuff, so this is a bad thing). N2O is produced by petrol and diesel in similar volumes; bad stuff9. The BBC10 directed me to DEFRA11
We use diesels in preference to petrol engines to reduce CO2. Design of petrol engines has caught up, so the difference is now slight. Diesel cars tend to be bigger than petrol, which helps wipe out the difference. Diesel is more efficient, but also contains more carbon, 1.12:1 says10, quoting the ICCT. Significant in the argument that affects politicians is this diagram10:
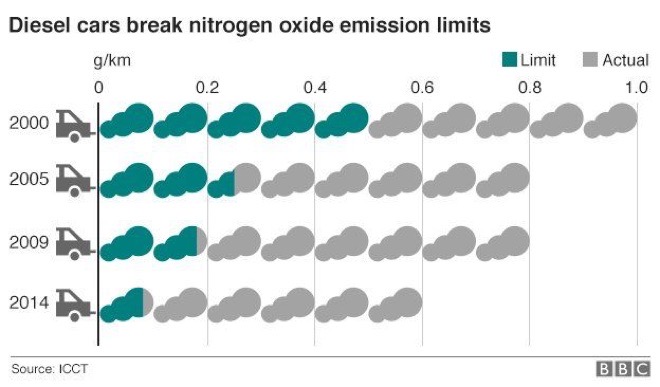
ICCT
SMMT12, while biased for one side of any argument about road transport, points correctly to pollution reduction historically per vehicle. Recognising that, they quote their sources so one can judge for oneself the likely truth in the statements. NOx emissions have dropped by a lot since 1970 (to about 2% of that figure
Euro 3 emissions
standards (diesel)
2000
CO: 0.64 g/km
HC + NOx: 0.56 g/km
NOx: 0.50 g/km
PM: 0.05 g/km
) and since 2000 (to about 6% similarly). Which begs one to ask what an acceptable level is. Diesel cars (or should that be vehicles, including lorries?) are driven further than their petrol equivalents (1.6;1). A test on London buses shows that the Euro-6 scheme is hugely better than the Euro-5 (98%, from 9 to 0.2 g/km on the buses tested by TfL
13, P10
)
Transport for London13 reports as follows: Despite permissible limits of NOx emissions at type approval reducing significantly, in-service emissions have, in reality, not reduced by anything approaching that amount. For example, in 1993 the permissible limit for NOx emissions from a heavy duty diesel engine was 8 g/KWh. In 2009, Euro V stipulated 2 g/KWh and for Euro VI in 2014, the limit is 0.40 g/KWh. However, emissions measured at the roadside, or in the test laboratory, are frequently of a much greater magnitude. (longer quote far below)
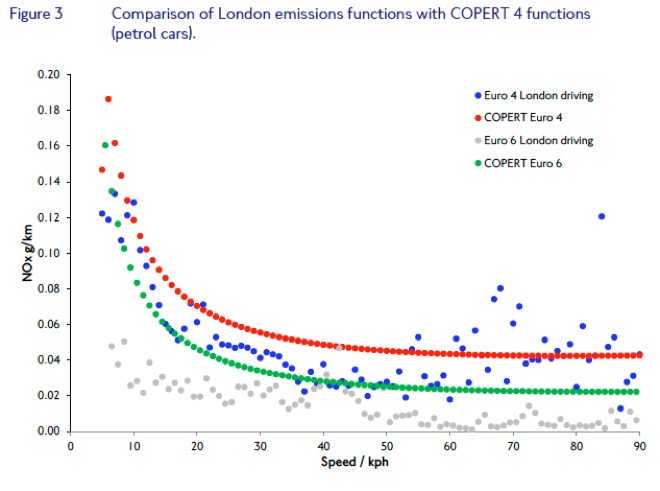
TfL ran some real world tests (see P11 of source13) at speeds they thought appropriate to London traffic and found NOx figures ranging 0.1 to 1.1, not the 0.08 that are required to meet Euro-6; the petrol cars met the limits, the diesels all failed. It is proposed that there be a multiplier of the test results to reflect real road use, and the number suggested has been 1.5, where TfL’s figures suggest th
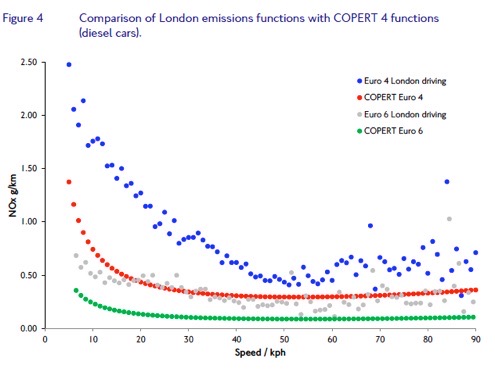
at 50 might be appropriate for the ‘wrong’ sort of diesel car. NOx emissions drop off sharply with speed and the TfL figures agree that this occurs with Euro-6 vehicles (but not Euro-4, see Fig3, P14, far below). However, the test figures for petrol are very reassuring, while those for diesel (Fig 4 far below), are disturbingly erratic and show that the Euro-6 cars’ emissions are surprisingly constant, trending downwards only a little but with the variability growing so that there are clearly some ‘Euro-6’ vehicles in breach of the Euro-4 standards when exceeding 30mph. Worrying, and demonstrably showing the need for significantly better tests; the VW scandal over testing is but the tip of an iceberg. If you read the article take care to understand what COPERT4 is (it models how Euro 6 cars behave on the road in terms of emissions) and how it relates to Euro6.
So the issue with diesel is that the test it has been designed to pass does not reflect well when used in reality; so the test will need to be modified. Fine. Meanwhile, it is also clear that some but not all of even the newer 2015, Euro-6 vehicles produce far too much (way more than is acceptable when compared to the standards) at slow speeds, which is what we have in our cities. Which is going to drive cities to exclude diesel engines whenever they can. Equally, the development of petrol
Euro 1 emissions
standards (diesel)
1992
CO: 2,72 g/km
HC + NOx: 0.97 g/km
PM: 0.14 g/km
hybrids is going to meet the demands of cities as demonstrated by the newer London bus. Whether that divides traffic into two types, one permitted inside cities and one on a severely restricted basis, we have yet to see. If park and ride actually worked...
You can understand any plea for older diesels to be taken off the road. Manufacturers would like to sell more vehicles, politicians would like evidence that their policies have been effective, we’d all like cleaner air. There are services to raise the standards on existing vehicles, of course, and we must applaud this – and anyone who uses such a service. Given the magnitude of the difference in emissions, one can argue that the sooner such rules are in place, the better. The political bomb is that the government has for decades encouraged the populace to buy diesel and now, apparently want us to not do so. So there are demands for compensation at being misled (think PPI). It seems to me that the obvious move is to legislate so that existing vehicles must meet (to be defined) modern standards or suffer restrictions (like not being allowed into cities); that new diesels must meet ever more exacting standards; that the penalties for failing to meet standards are raised (and real testing is done, perhaps at MOT). Since14 36% of vehicles out there are ≥10 years old (news to me), we clearly need an incentive to upgrade or replace those vehicles. If they were all new, there would be an 84% reduction in NOX, and 91% reduction in particulates.
Development of raw particle emission using the example of a diesel passenger car, VW Golf, NEDC [86]. Source 8 again.
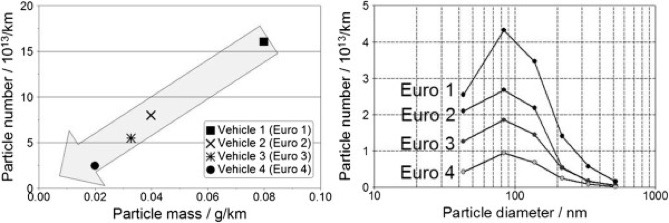
The Guardian15, addressing the demonisation issue, looked at the problem:
Diesel was supposed to be the answer to the high carbon emissions of the transport sector, a lower emitting fuel that was a mature technology – unlike electric or hydrogen cars. In the early 2000s the Blair government threw its weight behind the sector by changing ‘road tax’ (vehicle excise duty) to a CO2-based system, which favoured diesel cars as they generally had lower CO2 emissions than petrol versions.
It inspired British car makers to invest heavily in a manufacturing process that most countries outside Europe have ignored. In 1994 the UK car fleet was only 7.4% diesel. By 2013 there were 10.1m diesel cars in the UK, 34.5% of the total.
In an attempt to restore consumer confidence the car industry has produced leaflets (available at car markers and dealerships) as well as a “myth-busting” website. The campaign shows the growth of the diesel market and claims success for car makers in reducing emissions of NOx, particulate matter and CO2.
.... recent testing by the International Council on Clean Transportation found:
On average, real-world NOx emissions from the tested vehicles were about seven times higher than the limits set by the Euro-6 standard. If applied to the entire new vehicle fleet, this would correspond to an on-road level of about 560 mg/km of NOx (compared to the regulatory limit under Euro 6 of 80 mg/km).
An associated issue is that, as 14 points out, The carbon emissions tax regime currently levies £180 on a new petrol-powered Ford Mondeo. The rate for the diesel version is £0. What we are confusing is the old(er) arguments about CO2 production with the new(er) fuss about NOx production. Among the arguments is that diesel emissions are only 14% of NOx nationally; the response is that location (really, proximity) matters, so that, while a coal-fired power station equates to 42 million new diesels, we don’t tend to walk as close to a power station as we do to a car with its engine running.
Which, I suggest, is a very good reason for turning off the engine when stationary. Yesterday I ran past a line of mums waiting for primary school to finish. About half had their engines running, quite possibly to support the a/c (or the radio, since a similar proportion had windows open). But I chose to run the other side of the road, because even anosmic old me can detect poor air.
DJS 20170512
note we went from me to me, as predicted.
top pic from googling ‘diesel is bad”
I still wonder how bad my car is in absolute and relative terms, so I hunted a little longer; surely I’m not the only one who wants to know? Obligingly the Express wanted to point fingers at ‘bad’ cars, quoting a Which?16 report, though I took this from the Express, because they added the official limits.
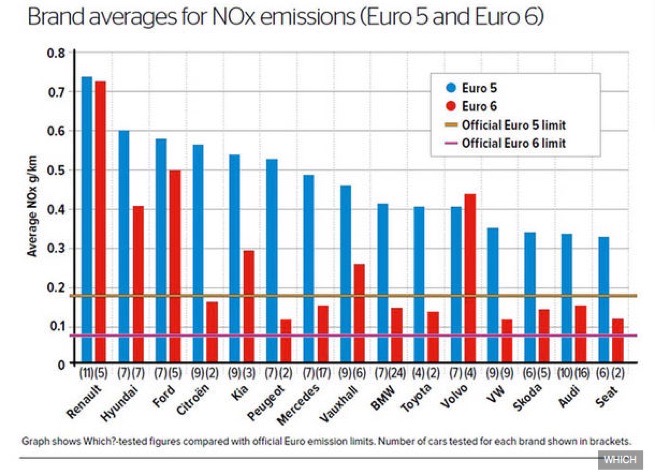
Just to be clear, Which? tested cars that should be meeting Euro5 or Euro6 standards under ‘realistic’ road conditions, specifically chasing NOx emissions and then aggregating results by manufacturer. The Which? report, as usual, reports what they found in no-nonsense language. Given the caveat they insert for VW group cars, I wonder what ‘realistic’ meant; the defeat device that VW applied to their cheaper (i.e. the VW brand) models came from the Audi engine management package, which notices when it is being run on rollers and
this
software was then tweaked to change engine behaviour to fit differently with the standard tests
17,18
. The NYT
18
explains which models of what cars were affected, which included all the 2009-16 3 litre diesels of Audi and VW and one of the Porsches. Funnily enough my Q3 is not in that list, though the Q5 and Q7 are. Trying to track down which Audis have the EA189 engine, the one that was allowed to contravene the rules, proved similarly difficult. It doesn’t apply to the Euro-6 models. Oh, relief. However, clarity is not easy to find, mostly because (i) one is no longer clear what source can be trusted (ii) so many sources are regurgitating content they have not checked for themselves. For most of these engines it is a straightforward software fix but no-one is admitting what that does to the performance; for the 1.6TDI EA189 engine there is also a flow transformer to be fitted (
Audi themselves). Audi has a webpage that lets you put in your VIN (tho’ for me they told me what my VIN was when I put in the registration) and then tells you directly if you’re affected by the fuss. That doesn’t tell you how your car fares in real measurement.
If you want to know about your car as a type, try looking at the EQUA site; they test an awful lot of vehicles. If you want your own vehicle tested, there is a philosophical problem whose source is the assumption that the MoT test is, and should be the (only) moment when testing occurs. But if you’re a sufficient shade of green you want to know that you yourself are compliant with the rules, and you might like to know the numbers, to see how well you comply – such as with the 2019 regulations (or even the Sept 2017 RDE regulations, RDE = Real Driving Emissions). I suggest you talk to your garage; they have the testing gear if they do MoT tests. However, I read that it is likely that you know more about the results than the testers – they’re only worried about pass/fail, not what is actually measured.
There is an irony in the VW, Dieselgate, scandal. By the time they were found out, they had fixed the manufacturing problem. That doesn’t excuse what was done, but it may make the situation comprehensible. Do not make the mistake of blaming only VW, or only German cars; read the figures for yourself at Which? and EQUA; have a good look at the Jeeps and the Peugeots. This may mean that car engine sizes increase; isn’t that odd?
DJS 20170512
I wrote most of this on the Friday but found the Times covering some of the same story on Saturday, so added this footnote on the Monday. Small edits made ten days later
1 http://www.air-quality.org.uk/26.php
2 http://www.dieselforum.org/about-clean-diesel/what-is-clean-diesel
3 http://www.nextgreencar.com/tools/emissions-calculator/
5 http://ec.europa.eu/environment/air/transport/road.htm worth using as a stimulus to direct you to other research.
6 https://www.theengineer.co.uk/preparing-for-stage-v-emissions-standards/
7 http://articles.sae.org/13624/
8 https://www.ncbi.nlm.nih.gov/pmc/articles/PMC3973853/ This is the real deal, proper descriptions of terms and in context. Excellent material to read, especially if you have an engineering bent. J Occup Med Toxicol. 2014; 9: 6.
Published online 2014 Mar 7. doi: 10.1186/1745-6673-9-6
PMCID: PMC3973853
Particulate emissions from diesel engines: correlation between engine technology and emissions
1
Andreas Wiartalla,
1
Bastian Holderbaum,
1
and
Sebastian Kiesow1
9 https://geminiresearchnews.com/2016/05/hva-er-det-egentlig-med-denne-nox-en/
10 http://www.bbc.co.uk/news/business-34257424
12 https://www.smmt.co.uk/industry-topics/emissions/facts-and-figures/
13 http://content.tfl.gov.uk/in-service-emissions-performance-of-euro-6vi-vehicles.pdf
14 http://www.naqts.com/air-quality-remains-a-priority-smmt/
16 http://www.which.co.uk/news/2017/03/which-tests-reveal-the-worst-diesel-cars-for-air-pollution/
17 Times Saturday 13/5/17 magazine, “How VW conned the world” from Jack Ewing, Faster, Higher, Farther: the VWScandal.
3 says: How we calculate CO2, NOx and PM emissions
The calculator estimates total emissions of carbon dioxide (CO2), nitrogen oxides (NOx) and particulates (PM10). The calculator also provides a breakdown of total emissions according to direct (tailpipe emissions) and indirect emissions (emissions generated during fuel and vehicle production).
Direct tailpipe emissions are calculated by multiplying the official or real-world emissions figure (in grams per km) by the journey distance or mileage (in miles), and a factor representing driving style (‘Normal, ‘ Aggressive/Fast’, ‘Eco-driving’).
Indirect fuel production emissions are based on published data quoted on an energy delivered basis (in grams per giga joule). These values are then multiplied by the vehicle’s official or real-world fuel economy (in litres or kWh per 100 km), the journey distance or mileage (in miles), and a factor representing driving style (‘Normal, ‘Aggressive/Fast’, ‘Eco-driving’).
Indirect vehicle production emissions are estimated which represent emissions associated with the vehicle’s manufacture. The approach is based on a per kg emissions for each vehicle type (petrol, diesel, electric, etc) which is then multiplied by the mass of the model selected.
In cases where real-world RDE data is available, the estimates for CO2 emissions have a high level of confidence. Where no RDE data is available, the estimates are based on the average discrepancy between official and real-world performance, and average correlations between emissions, driving style and road conditions.
Real Driving Emissions (RDE)
It is widely accepted that the official data for emissions are far from accurate, measured as they are in the laboratory. The NGC Emissions Calculator therefore uses Real Driving Emissions (RDE) where available to provide an accurate indicator of environmental impact.
Real-world emissions and MPG are estimated using the EQUA Indices for Air Quality (NOx), Carbon Dioxide and Fuel Economy as provided by Emissions Analytics.
Next Green Car has partnered with Emissions Analytics to improve the NGC Emissions Calculator through the use of model specific Real Driving Emissions (RDE) data for NOx, CO2 and MPG. This data is measured using portable testing equipment during real-world driving.
In cases where RDE data is available, the NGC Emissions Calculator uses a vehicle’s EQUA Indices (banded) as measured in real-world driving conditions by Emissions Analytics. In cases where no RDE data is available, the emissions calculation is based on official test data which is multiplied by a ‘conformity factor’ to estimate real-world emissions.
To find out more about Emissions Analytics’ EQUA database, or to view the EQUA Indices for a specific UK model, visit the Emissions Analytics website.
Source 8 gives this in conclusion:
Diesel engines in both passenger cars as well as commercial vehicles have undergone a rapid development in the past 30 years towards more efficiency, environmental protection and comfort. The technical developments responsible for the drastic emission reductions include all kinds of aspects ranging from the fuel to the engine’s combustion system down to the exhaust aftertreatment. The development of the engine control has also been a major influencing factor. While engine control used to be purely mechanical in the past, electronic control units are now used in most cases. Depending on the operating point, this permits the precise control of the engine components and the combustion cycle, something that cannot be done with mechanical means. These significant changes over the past decades must be considered when evaluating particulate emissions in Euro 1 engines in comparison to advanced Euro 6 engines.
Nowadays, in-engine measures for optimizing combustion management permit the minimization of particles and nitrogen oxides at reduced consumption and higher output. Cooled exhaust gas recirculation effectively reduces NOx emissions. Improved injection systems with greatly increased injection pressure and multiple injections permit a better mixture formation and a reduction of the combustion temperature, thus reducing NOx and particles. Using adjusted boosting systems with charge air cooling, it is possible to implement increased boost pressures. They lead to a higher cylinder charge, resulting in a lower combustion temperature with lower NOx emissions as well as a leaner combustion air ratio and therefore lower particulate emissions. By optimizing the combustion systems with regard to the charge movement in the combustion chamber as well as the geometry of the combustion chamber, the mixture formation can be further improved. Overall, particulate emissions can be reduced substantially with the described in-engine measures without causing a negative effect on the particle size distribution towards smaller particles.
Thanks to the introduction and improvement of exhaust aftertreatment systems, the pollutant concentration was also reduced considerably. The diesel oxidation catalyst (DOC) for example reduces the concentration of hydrocarbon and carbon monoxide emissions by nearly 100% after it has reached its operating temperature. Additionally, the DOC reduces the hydrocarbons adhering to the soot particles, while the portion of elemental carbon remains almost unchanged. The development of sulfates at the DOC no longer poses a significant problem for today’s mostly sulfur-free fuels in Europe. The remaining particles are effectively collected in the diesel particulate filter (DPF), whose filtering efficiency with closed design is near 100%, regardless of the particle size or operating mode of the engine. In addition to the closed particle filtering systems, so-called particle catalysts are also used in some applications, which have lower filtration efficiencies than a closed filter because of their principle. However, the particle number across the entire spectrum of sizes will be reduced here as well. SCR catalysts (Selective Catalytic Reduction) and NOx storage catalysts are used for NOx reduction downstream of the engine.
The fuel grade has also improved over the past few decades. The permissible sulfur content in the period from 1965 to 2005 for example has dropped from 1% to 0.005%, which lead to an immediate reduction in particulate emissions. In addition to mineral oil-based diesel fuels, 1st generation biofuels (FAME, RME, hydrogenated vegetable oil) as well as gas-to-liquid are increasingly used. These generally have a positive influence on particulate emissions and do not lead to an increase in particle number emissions.
In conclusion, the particulate emissions of advanced diesel engines can be drastically reduced in terms of the particulate mass and the particle number by using closed particulate filters. In-engine measures also lead to a clear reduction in particulate emissions. When measuring particle number and mass, we can see a clear correlation. Reduced particle mass emission is always associated with a reduction in particle number. Statements claiming that advanced engines are emitting a particular high amount of small particles were proven incorrect since they are based on measurement errors. There is no significant increase in small particles in the range of < 30 nm at the engine outlet because of advanced engine concepts. Particulate filters that were universally introduced for passenger cars with emission standard Euro 5 and became the state-of-the-art with Euro VI in commercial vehicles as well, are filtering particles in the entire operating range of the engine across the entire particle size range with high efficiency, which can be explained by the separation principle in the filter.
With the introduction of Euro 6 for passenger cars, it was possible to further reduce the permissible emissions especially for nitrogen oxides; with the introduction of Euro VI, both the particulate as well as the NOx emissions were further reduced drastically for commercial vehicles. With Euro 5b for passenger cars and Euro VI for commercial vehicles, a particle number limit has been introduced additionally that drastically increased the requirements even further. Since the introduction of the exhaust emission standards in Europe, all pollutant components have already been reduced by more than 90%. Additionally, increasingly stringent measures are being introduced for monitoring emissions in real-life driving operation over the life time of the vehicle. Further steps in the legislation for reducing the emission limits are to be expected in the future. In addition, the focus will increasingly be on CO2 emissions.
From Transport for London13, The NOx problem
Since the Euro standards first became mandatory for new vehicles in 1993, there have been successive reductions in the permissible limits for four legislated air quality pollutants; carbon monoxide (CO), hydrocarbons (HC), oxides of nitrogen (NOx) and particulate matter in the ten micron size range (PM10). The test procedure has also given rise to the official test of carbon dioxide (CO2) emissions and fuel consumption used for vehicle excise duty and new car advertising. Of these, NOx and PM10 are the emissions of greatest interest because of their effects on human health and EU legislation limiting permissible ambient concentrations. Particulate emissions from diesel exhaust are increasingly well controlled, giving rise to new attention on particulate emissions arising from tyre and brake wear. However, NO2 ambient concentrations, and therefore NOx emissions, remain a significant challenge.
Despite permissible limits of NOx emissions at type approval reducing significantly, in- service emissions have, in reality, not reduced by anything approaching that amount. For example, in 1993 the permissible limit for NOx emissions from a heavy duty diesel engine was 8 g/KWh. In 2009, Euro V stipulated 2 g/KWh and for Euro VI in 2014, the limit is 0.40 g/KWh. However, emissions measured at the roadside, or in the test laboratory, are frequently of a much greater magnitude.
This is widely attributed to what are known as ‘off-cycle emissions’. This effect may be viewed as a failure of the legislation, since the type-approval tests are tightly prescribed and engine manufacturers are obliged to develop specific control strategies to ensure a satisfactory test. However, once type-approved, a heavy duty engine (or a complete car or van in the case of light duty vehicles) may well be operated to different duty cycles to those of the initial approval. Under these circumstances the engine emissions will be quite different to those seen at type-approval, frequently resulting in higher emissions of NOx. This has led to widespread observations of NOx emission levels much greater than the type- approval legislation would suggest might be expected. This phenomenon has been widely reported for Euro V heavy duty vehicles.
In drafting the legislation for Euro 6/VI, steps have been taken by the European Commission to correct this problem. For heavy duty diesel engines, where the approval takes the form of an engine-dynamometer ‘bench’ test, the engine must conform to the required limits over a broader window of speed and load settings. This is followed up by a requirement to verify the emissions performance over a period of on-highway driving with portable emissions analysis equipment fitted to the complete vehicle. These new measures seem, at this early
9
stage, to be effective in controlling ‘off-cycle emissions’ much more successfully than before. However, they still do not guarantee universal compliance with the standard under all driving conditions.
Authorities across Europe have a responsibility to work towards Limit Values for ambient concentrations of nitrogen dioxide (NO2). A principal source of NO2 is the NOx emitted from road vehicle exhausts, particularly from diesels. NO2 is, for the most part, formed when nitric oxide (NO) present within the exhaust gases oxidises within the atmosphere to form NO2. Thus, one way to control NO2 formation is to reduce emissions of NOx and its constituent NO.
However, efforts to reduce emissions of particulate by the use of diesel particulate filters on both light and heavy vehicles, has had the unintended consequence of increasing emissions of NO2 direct from the vehicle exhaust (known as primary NO2). This is caused by the action of catalytic coatings within the particulate filter, which are used to cause the filter to regenerate periodically. This trade-off between effective control of particulate matter and formation of an increased NO2 fraction within total NOx emissions presents an additional challenge.
and, later, the TfL report concludes:
10. Conclusions
It can be seen from this analysis of test results that, in urban driving, Euro 6 petrol cars emit very low levels of NOx, consistently less than would be suggested by the COPERT 4 emissions functions. Diesel cars at Euro 6 also show a significant improvement over those at Euro 5, although the plotted emissions are higher than the COPERT 4 functions would suggest. Some models of light-duty diesel vehicles may require re-calibration to satisfy the RDE protocol for emission verification, depending on the conformity factors that are agreed with the European Commission. It is therefore extremely important that the level of conformity factor is set so as to be challenging and that the implementation date is not allowed to slip beyond the proposed 2017/2018. This is necessary to ensure that NOx emission reductions are maximised.
TfL has now tested examples of heavy-duty buses (MLTB cycle) and heavy-duty goods vehicles (TfL Suburban Cycle) at Euro VI. In each case, the results have been impressive, with emissions of NOx significantly reduced from vehicles at Euro V. This is especially true at lower road speeds, which is clearly advantageous for urban and suburban areas.
One area of concern, and for possible further research, is that of primary NO2 emissions. This is the fraction of total NOx which is constituted of NO2 at the point that it leaves the vehicle tailpipe. There are suggestions from some quarters that this may be more important when considering human exposure in urban streets than the emissions of NO (which later oxidise in the atmosphere to form secondary NO2). Some diesel exhaust after-treatment systems increase the fraction of total NOx which is NO2, despite reducing the total mass emission of NOx. There are discussions at the European Commission, although nothing is definite, about a potential primary NO2 limit, which may even constitute a future Euro standard (Euro VII ?).
Separately, engine manufacturers and European legislators are turning their attention to reducing carbon emissions from vehicles (CO2). For passenger cars, plug-in vehicles are starting to achieve wider acceptance, whilst for heavy-duty vehicles, where battery technology is not yet viable, there is still scope for
<something missing>
221 - House Prices

I understand why the press have decided that housing is an issue for the election, but do not understand – as ever – their apparent agenda.
Among the issues I can see as relevant:
- • There are too few houses
• Houses are too expensive
- • Stamp duty is pernicious
- • There are too many unoccupied houses
- • People want to own their residence
Demand:
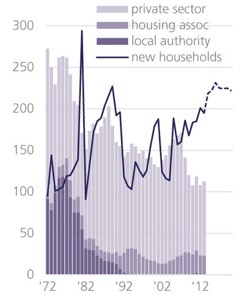
This is affected by rising life expectancy, by population growth and the increase in single-person households. Quoting the excellent source1, from which these diagrams are taken, Estimates put the need for additional housing in England at between 232,000 to 300,000 new units per year, a level not reached since the late 1970s and two to three times current supply.
Issues to consider in this matter are
- • why we have the shortfall between demand and supply
- • how the green belts are continuously eroded
- • the failure to supply social housing
- • planning (obstacles, reform, or sense)
Expense:
A relevant measure I coined myself
before I found it used in other places, is the multiplier from income to house price. You can argue a divisor for joint incomes (I suggest √n). So my several houses in Britain, applying √2 to our joint incomes, provide a personal progression of { 7, 7, 7, 5, 4, 9, 13} where the last two are inappropriate since retired. If I include spouse income we hit a low in the 80s and 90s (when we had kids), but I’ve had no mortgage since about the age of 50.
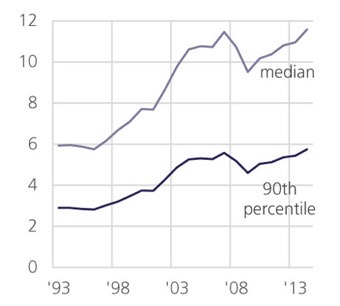
Mortgages are awarded on the basis of a multiplier of income, typically 3 to 5 but this varies with the economic climate (the factor is higher when inflation is low). The diagram (
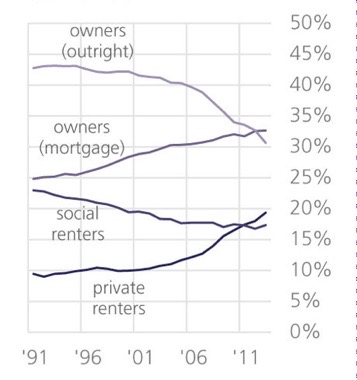
same gov.uk source) shows this as measured by them. Similarly relevant is the extent to which mortgage plays a part, which the paper covers too (I wanted this, and there it was).
Those who do not have a house complain that houses are expensive. The world is like that, hard luck. Those who do have a house are keen for the market to rise, especially to do so faster than inflation, with something-for-nothing appeal. (It has done, at 7% per year since 1980; source5.) You can view this as incentive to buy, incentive to invest—the bank of mum and dad, particularly—or you can take the opposing view that says this is a bad thing. In between these two is the issue of ‘affordable housing’ which has issues of its own: rented housing that fits somehow with earnings (which might mean political expectations of that); housing sold at some negative premium that is later converted into ‘free’ capital gain (and every existing house-owner will be against that, because that is someone else having too much for nowt). This is a balance of expectation against practicality. A part of the problem is that the scenery has changed; what applied to my grandparents most definitely does not apply to my grandchildren.
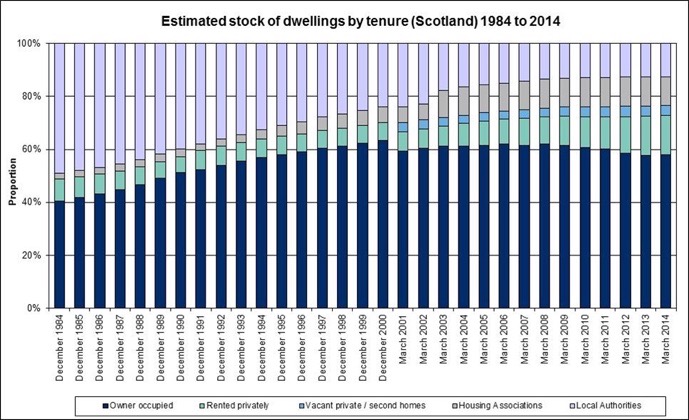
I note that while ownership is 63% in England, it is much lower in Scotland and I’ve inserted a diagram from here among those at the foot of this page.
Stamp duty:
I use this label to refer to all taxation on housing,
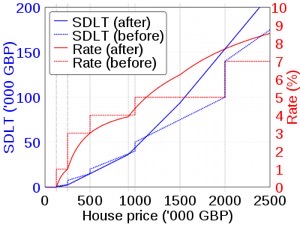
I see this one as the dominant factor. Stamp duty is actually paid as a levy on documents (
source), and the special form applying in Britain is stamp duty land tax, SDLT, which applies, obviously, to land and property transactions. Rates are on a scale that encourages first-time buyers (no tax below a figure), discourages very expensive housing (the million mark) and second homes (add 3% from 2016).
2nd source.
There is complaint that this raises ‘too much money’ from those campaigning for election. I do not see this at all (and I’ve paid it recently). It seems to me that this is a progressive tax that succeeds; it encourages people to purchase housing (0% up to £125k, 1% up to £250k, it then progressively discourages the market from increase, so that the SDLT on a property selling at just over the million mark is £50k. Arguments that this depresses the housing market cause me to observe that this is what was wanted, a slowing of the market to the benefit of those without houses.
Other attached costs to housing include council tax, but that is to my mind better seen as paying for services, not a tax on ownership.
The cost of moving is not a tax but it is a disincentive to move. Items to include here are fees to solicitor (conveyancer), estate agent, moving company. I predict the first two to come down in price as a feature of progressive automation. In my opinion, estate agents are on a losing wicket and that this market is ripe for a drastic change.
Unoccupied houses:
SDLT applies to second homes at an extra 3%, as above. This could be increased significantly. We’ve just been through this in choosing to sell in Wallsend slowly and discover that the tax is recoverable – that is, it applies to the period in which one owns more than one property. Politically, we need to establish what the problem is, and I think that it is simply one of occupation. A house that is rented is not a social problem – the space is in use. There were 600,000 empty dwellings in England in 2015 (source3):
In early 2014 there were approximately 23 million dwellings in England, of which 63% were owner occupied, 20% were private rented, and 17% were public housing.[35] The overall mean number of bedrooms was 2.8 in 2013-14, 37% of households had at least two spare bedrooms.[7] 20% of dwellings were built before 1919 and 15% were built post 1990.[7] 29% of all dwellings are terraced, 42% are detached or semi-detached, and the remaining 29% are bungalows or flats. The mean floor area is 95 square meters.[7] Approximately 4% of all dwellings were vacant.[7] Approximately 385,000 households reported a fire between 2012 and 2014, the majority of which were caused by cooking.[36] In 2014 2.6 million households moved dwelling, the majority of which (74%) were renters.[7]
Homelessness figures for 2014/5 were 2400 rough sleepers and 67000 households in temporary accommodation. See additional info.
There are a million empty homes in England (source6), 5% of the stock. Mostly this is evenly divided between owned and rented. Diagram at foot.
I can see political success in raising the SDLT on second homes to some significant figure. I see significant gains in taxing empty housing and a target right now (election campaign running) will be housing owned but left empty as investment, especially that owned by non-Brits since they are also non-voters, so all voters will agree that these people pay excess for the privilege of denying space to others. Is there a downside to this, politically? I do not see one. SDLT currently amounts to £11 billion (source, 3rd page). Hunt for yourself here. This also tells you about the activity in the market; for example 2016 had over 200,000 residential sales each quarter.
People want their own residence:
I do, my children do, but that doesn’t mean we should, nor should we expect to. Source5 (for which I can’t steal the diagrams but you can read them for yourself) says that the number of first-time buyers is dropping, from 600,000 per year in 1985 to 200,000 in 2008-11. Rising house prices could partially explain the decline in the number of first time buyers taking out a mortgage, although other economic factors will play a role. From the 1980s until the early 2000s there were typically between 400,000 and 600,000 loans to first time buyers each year. However, in 2003 there was a 31% decline and then in 2008 there was a further 47% decrease—the largest in the series—as the economic downturn affected the housing market.
One should be wary of inexplicit assumptions in the reported figures and you should go read the originals for yourself – you may well be assuming that I’ve read enough, when I know I have not.
I discovered6 some things about the housing stock (2014 report) and I put an abstract in blue at the bottom. It tells you what to call a house but it doesn’t tell you what you want but what there is. It doesn’t tell you what you can or cannot have, nor whether any house in Britain is what we might call good stock – nationall,y we have pretty poor stock in the sense that it is expensive to run.
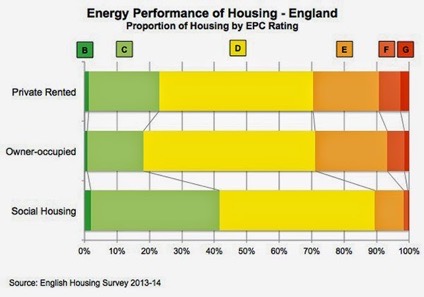
If you use your EPC A-G grading, you can tell what a typical house costs to run. You might modify that to reflect your own usage, and what I failed to find were figures telling me how this changes with age and circumstance, but I suspect I’m asking for far too much in that regard. What would be useful would be an index comparing price (market value perhaps) with running costs. Diagram here from source
6
shows that social housing is of relatively good quality. Personally, I see C grade as achievable and desirable for all of us. Far too many homes are rated D and lower (hence “we have pretty poor stock”), Scotland’s figures are slightly better, having more in band C throughout. Some see a similar
need8; what is needed is for the complete EPC database to
be freely available.
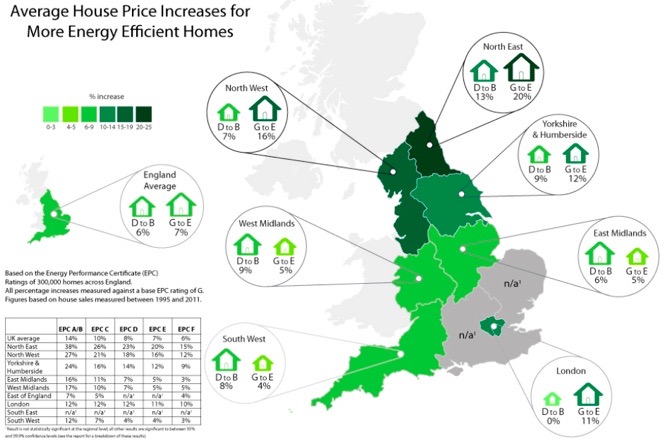
EPC ratings are beginning to have an effect upon perceived value. I am a strong supporter of having the information and it tells me what figure to put on development of a property. Whether any valuer applies a similar thinking I cannot tell. From 9, which is worthy of greater study;
There are certain property attributes that are important determinants of price; size, location and type of dwelling being the more obvious ones. Energy efficiency, although growing in importance, is undoubtedly a weaker determinant in comparison.
There are significant positive effects on dwelling price appreciation per square metre for dwellings rated B, C and D compared to dwellings rated G.
We estimate that, compared to dwellings rated EPC G, dwellings rated EPC F and E sold for approximately 6%, dwellings rated D sold for 8% more and dwellings rated EPC band C for 10% and A/B sold for 14% more.
What is pathetic is the huge volume of housing below grade C7 on the EPC scale. What is similarly poor is the lack of recognition of return on value for making improvements. Successive governments have tried (look, say at the free roof insulation), but with limited success. If we are to upgrade our housing stock in numbers, range and quality, we need some political action that is genuine in its drive for long-term improvement. That calls for unanimity, for which politicians are not well-known. Yet the figures are not in dispute, as far as I can tell, which gives hope that we may at least have a discussion which begins with some agreement.
Changing society’s attitudes requires us to have incentives to change. Brexit might depress the currency and just might eventually cause property prices to drop, but not while demand continues to exceed supply. We need to recognise benefits from efficient use of space, money and energy and we need to encourage ourselves into much better use of these scarce resources. Whether that means that the rich should be in any sense penalised for being able to afford to waste resource is a different matter entirely. I think the test is whether resource is being denied to others and that that is what should be penalised.
DJS 20170504
local mayoral election polling day
top pic, Tregunnon
I am happy to report that the SDLT I paid for owning two houses has been recovered, six months after reducing back to one residence. My solicitor says I am the first customer of hers to have actually collected. I don’t know that that last tells us anything.
Our new house, new to us, has EPC down at F at the time of purchase. What we sell is a C, as was the one we sold earlier in the year. It will be fun changing an F to a C.
https://en.wikipedia.org/wiki/Affordability_of_housing_in_the_United_Kingdom
3 https://en.wikipedia.org/wiki/Housing_in_the_United_Kingdom do read this!
4 http://www.gov.scot/Topics/Statistics/Browse/Housing-Regeneration/TrendTenure Some Scottish figures
5 http://visual.ons.gov.uk/uk-perspectives-2016-housing-and-home-ownership-in-the-uk/
6 https://www.gov.uk/government/uploads/system/uploads/attachment_data/file/539600/Housing_Stock_report.pdf well worth a read. What I did not find were the gov.uk reports where I can simply copy the diagram – what is on offer is the data itself. Applause.
7 http://www.solarblogger.net/2015/05/how-energy-efficient-is-uk-housing-stock.html
9 https://www.gov.uk/government/uploads/system/uploads/attachment_data/file/207196/20130613_-_Hedonic_Pricing_study_-_DECC_template__2_.pdf
Again, well worth reading.
Additional Displays:
from 3:
from
4
;
from
5
see the mix-adjusted house price index here:
House Price Index - February 2016 (Table 22), ONS
from 6
see the mix of vacant dwellings here, fig 1.6.
Average usable floor space is 94 square metres. Around 31% had less than 70m2 and 39% had at least 90m2 of usable floor area, Annex Table 3.1.
On average, the size of England’s 2.4 million smaller terraced houses was 64m2 in 2014. Larger terraced houses had an average floor area of 101m2; this average was higher than that found among semi-detached homes (96m2). The usable floor space of just under half of larger terraced houses were between 70 and 89m2 (47%) and over half (53%) had at least 90m2 of internal space, Annex Table 3.1
While the average available floor area of semi-detached homes was 96m2, the size of these homes varied greatly; 14% had less than 70m2, 43% had between 70 and 89m2, and 43% 90m2 or more. Detached homes tended to be the largest, with an average 147m2 of usable floor area. The majority of these homes (88%) had at least 90m2 of usable floor space.
On average, bungalows had larger floor areas (77m2) than small terraces (64m2) and had a lower proportion of the smallest homes (less than 70m2), 53% compared with 70% among small terraces.
The average sized flat was 61m2, slightly lower than the average for small terraced houses. Flats were most likely (75%) to have less than 70m2 of internal space compared with all other types of homes. Only 7% of flats had over 90m2 of internal space.
Overall, over half of English homes (54%) had five or more habitable rooms while 8% consisted of two or fewer habitable rooms.9 Most of the smallest homes (of less than 70m2) had three habitable rooms (40%). For medium sized homes (of 70-89m2), just over half (53%) had five or more habitable rooms, whereas 90% of largest homes (over 90m2), had at least five or more habitable rooms, Annex Table 3.2.
Small terraced houses most commonly (46%) had four habitable rooms (the traditional two up two down) while around one quarter (24%) had five or more habitable rooms. In contrast, around three quarters (73%) of larger terraced houses had five habitable rooms or more. The findings for semi-detached houses were largely similar to those for larger terraced homes, Annex Table 3.2.
The vast majority of detached houses had five or more habitable rooms (93%). Most commonly, bungalows had three habitable rooms or fewer (39%), 30% had four habitable rooms and 31% had five or more of these rooms.
Roughly one third of flats (34%) had two or fewer habitable rooms and just under half (45%) consisted of three habitable rooms.
Small terraced houses most commonly (59%) had two bedrooms.10 Not surprisingly, larger terraced houses tended to have more bedrooms than smaller terraces; 62% of larger terraces had three bedrooms, and a further 23% had four or more bedrooms. A similar overall pattern was seen for semi- detached houses; 69% had three bedrooms and 18% had four or more bedrooms, Annex Table 3.3.
Most detached homes (63%) had four or more bedrooms, reflecting their larger size, while 50% of bungalows had two bedrooms. Just over half (51%) of flats contained two bedrooms, 39% had one bedroom and the remaining 10% had three or more bedrooms.
Owner occupied homes were generally larger in size; with average usable floor space of 106m2 compared with 77m2 for private rented homes and 67m2 for social sector homes. This difference by tenure was observable among all dwelling types except for small terraced houses, Figure 3.3.
Overall, owner occupied homes were most likely to have five or more habitable rooms than rented homes of an equivalent size, Annex Table 3.5.
Among the smallest homes (less than 70m2), the proportion with four or more habitable rooms was notably higher in owner occupied homes (44% compared with 31% of private rented homes and 21% of social sector homes). Owner occupied medium-sized homes of 70 to 89m2 were more likely to have five or more habitable rooms (58%) compared with roughly half of rented homes (47% of private rented and 45% social rented).
The vast majority (92%) of the largest homes (90m2 or over) that were owner occupied had five or more habitable rooms compared with the equivalent sized social sector (79%) and private rented homes (84%).
7 Passing from D to C means, for most of us, taking steps to provide renewable energy, either by having solar panels of either type or by recovering energy from elsewhere, such as using heat pumps to extract heat from flue gases or from under the garden.
The things you are likely to be told to do, in order of effectiveness are:
- •Insulate the roof up to 250mm, probably paid for by the state, but that will only be done in the easily accessed bits, while the EPC surveyor will look at the places where that wasn’t done (all those little lean-to extra roofs that house grow like carbuncles)
- •Cavity insulation, also funded by the state. issues in places with extreme weather, as the cavity is there to keep a gap between skins of brickwork and so rain that penetrates the outside skin is supposed to drain down the inside face of the outside wall, then out through the perpends (I don’t need to look any of this up). Bridging the cavity helps any water in that cavity to move to the inside skin, which gives you unwelcome wet patches and cause for complaint. Hell to fix.
- •Replace ALL the lights with low-wattage things. Very cost-effective; the EPCs i have read carefully suggest that the first year spend will be recovered in the next year. However, we tend to use more lights in the ‘new’ scheme, and we don’t make energy conservation a target. Issues with the heat going past the new bulb and subsequent other heat losses. Lesson: be clear what it is you are replacing: bulb? Cheap, effective. The whole light? Spend a lot more or you’ll undo the good you think you’re doing.
- •Under-floor insulation. Not fun to do, since the headroom is usually far less than you want. Not cheap in terns of time, nor particularly cost-effective, because (i) the wooden joists can’t be covered, since then they’ll get rot and (ii) because you did the most effective stuff already. It is quite tempting to replace wooden floors with solid floors incorporating heating. or move house, which doesn’t fix the national problem, but fixes yours. We need more incentive from the state.
- •For many of us this is now the High Ds, but those with pre-war housing will, I reckon, need to do even more wall insulation inside or outside. Much longer return, since you’ve done so much already. Unless this is recovered by the market putting a value on the EPC, and unless this nudges you from D to C, you may not see enough return to justify it.
- •Now you’re about to step across a boundary. Solar panels of either sort (see essay 218). If the Feed-in tariff still applied, this step was more effective than the last.
- •Further still, do both of the panels AND then go for energy recovery. Look up domestic RHI; your talking heat pumps recovering heat from flue gases or stealing it from under the garden, or changing your boiler over to biomass. These work if (i) you are capital rich but not income-rich (ii) you’re doing lots of other building work at the same time (iii) you have loads of space (which may mean space of the right kind).