
1. There are two measures of pollution when we’re looking at fine particles in the air. One counts micrograms per cubic meter and the other is an Air Quality index, Use the blue content below, which is discussing the two scales, to produce a graph with the pollution concentration figures along the x-axis. The graph is a collection of straight lines. Label and title your graph properly; take care with this because you’ll want to use the graph to answer other questions.
Thanks to Louie Cheng at PureLivingChina.com, who says the PM concentration / AQI relationship is a linear interpolation between the relevant boundaries. This is deliberately obscure English for you to unravel.
From 0-50 the two scales are equal, they equate. From 50-200 of AQI, the concentration goes from 50-350, in a two-for-one way. Once we pass 200 on the AQI scale the next 100 on the index are 70µg/m³, so the 235 I read as AQI (API) is 375µg/m³ (200+35=>350+35x0.7 = 374.5), ten times the official action figure in Britain. From 300 to 400 of AQI we scale the next 80, so an index of 360 = 300+60=> 420+60x0.8 = 468µg/m³ From 400 to 500 we go back to 1:1, so the declared 799 from January 2013 was 899µg/m³, so many times over the danger mark of the west that there’s little point in doing arithmetic with it.
2 From your graph, check that (375, 235) is on your line and find (i) the AQI when the pollution concentration is 250 µg/m³ and (ii) the pollution concentration when the Air Quality Index is 120 and (ii) when AQI=250.
3 When the AQI is 200, it says above that the concentration is 350µg/m³, so
(i) How much, µg, is in the air in your lungs if your lung capacity is 3 litres?
(ii) If you’re breathing hard outside, maybe 30 breaths a minute, how much mass of fine particles have you taken in over a 45 minute games session?
Any complaints? save them for 4 (iv)
4 (i) If the pollution level indoors is at 150 µg/m³, how many milligrams of dust would you have breathed in between 08:30 and 15:30 at 10 breaths a minute?
(ii) If the average level for a day is an AQI of 100, what is the pollution concentration?
(iii) take that last figure and apply it to you breathing in and out for a whole year at 10 breaths a minute. How many grams of pollutant went into the lungs?
(iv) What might be wrong with the assumptions in these calculations? Find at least two criticisms.
5 Here’s a graph comparing a megacity pollution index, MPI, with a measure of the knowledge generated in a region, KIR.
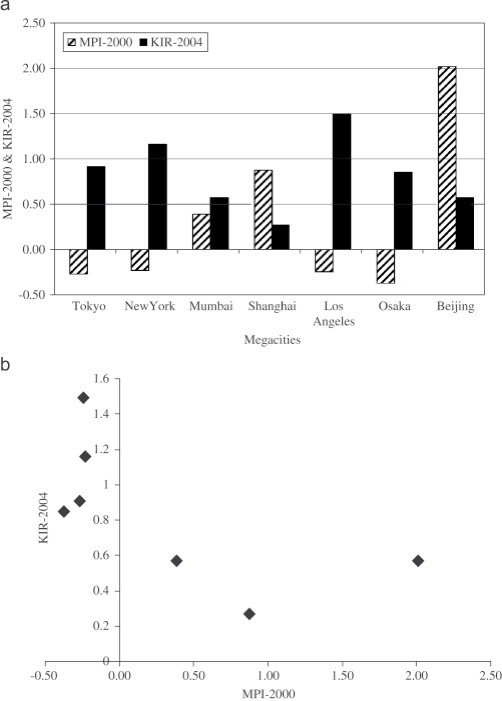
The top figure is the Fig 7 from the www.sciencedirect.com paper. This graph compares MPI with KIR in different years (which may be a criticism) in different cities.
Write down some statements reflecting observations you can make appropriately at KS3 or KS4 — three would be appropriate.
Graph (b) is the one that gets me excited – a use of correlation as taught to year 7 that actually tells us something. Labelled co-variation (I disagree that that is what covariation means, but I can see what they’ve done), they have plotted one characteristic against another, as we would do at school and in the classroom.
EXERCISE: Y12: Find the correlation coefficient,
Y13: declare whether this is significant for a sample of 7.
Q3 350*3/1000 = 1.05 micrograms, µg; 1.42 milligrams, mg.
Q4 1.89mg; 150µg/m3; 142 grams. Assumptions: that what goes in stays in, meaning both that our bodies don’t find ways to lose the dust absorbed and that what we breathe in sticks to the lungs.
Q5 Answer must include correlation, gradient, dispersion.
y=1.4-1.4x within the ability to estimate values from the graph. r= -0.618, n=7 on my calculation. So weakly negatively correlated and not quite significant., as if connected to other factors - a likely condition. Valid to say that pollution lowers the ability of a city to generate knowledge, since there is no counter-example.
