
I understand why the press have decided that housing is an issue for the election, but do not understand – as ever – their apparent agenda.
Among the issues I can see as relevant:
- • There are too few houses
• Houses are too expensive
- • Stamp duty is pernicious
- • There are too many unoccupied houses
- • People want to own their residence
Demand:
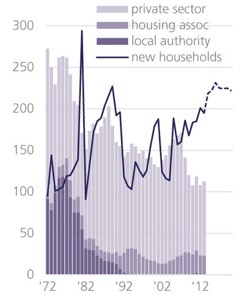
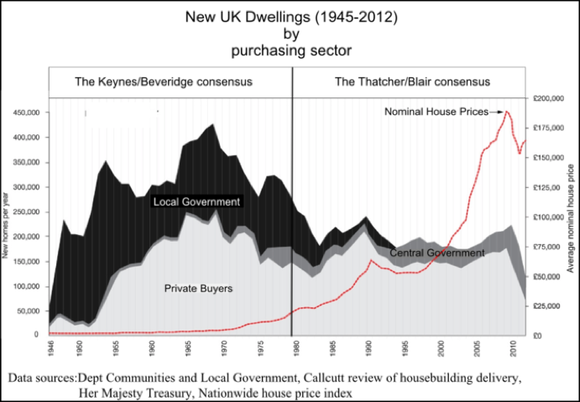
This is affected by rising life expectancy, by population growth and the increase in single-person households. Quoting the excellent source1, from which these diagrams are taken, Estimates put the need for additional housing in England at between 232,000 to 300,000 new units per year, a level not reached since the late 1970s and two to three times current supply.
Issues to consider in this matter are
- • why we have the shortfall between demand and supply
- • how the green belts are continuously eroded
- • the failure to supply social housing
- • planning (obstacles, reform, or sense)
Expense:
A relevant measure I coined myself
before I found it used in other places, is the multiplier from income to house price. You can argue a divisor for joint incomes (I suggest √n). So my several houses in Britain, applying √2 to our joint incomes, provide a personal progression of { 7, 7, 7, 5, 4, 9, 13} where the last two are inappropriate since retired. If I include spouse income we hit a low in the 80s and 90s (when we had kids), but I’ve had no mortgage since about the age of 50.
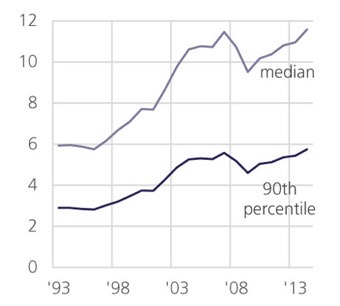
Mortgages are awarded on the basis of a multiplier of income, typically 3 to 5 but this varies with the economic climate (the factor is higher when inflation is low). The diagram (
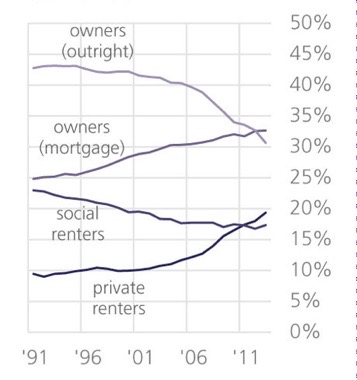
same gov.uk source) shows this as measured by them. Similarly relevant is the extent to which mortgage plays a part, which the paper covers too (I wanted this, and there it was).
Those who do not have a house complain that houses are expensive. The world is like that, hard luck. Those who do have a house are keen for the market to rise, especially to do so faster than inflation, with something-for-nothing appeal. (It has done, at 7% per year since 1980; source5.) You can view this as incentive to buy, incentive to invest—the bank of mum and dad, particularly—or you can take the opposing view that says this is a bad thing. In between these two is the issue of ‘affordable housing’ which has issues of its own: rented housing that fits somehow with earnings (which might mean political expectations of that); housing sold at some negative premium that is later converted into ‘free’ capital gain (and every existing house-owner will be against that, because that is someone else having too much for nowt). This is a balance of expectation against practicality. A part of the problem is that the scenery has changed; what applied to my grandparents most definitely does not apply to my grandchildren.
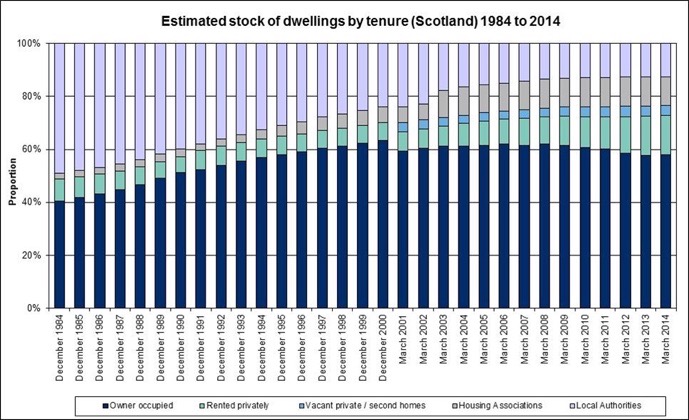
I note that while ownership is 63% in England, it is much lower in Scotland and I’ve inserted a diagram from here among those at the foot of this page.
Stamp duty:
I use this label to refer to all taxation on housing,
I see this one as the dominant factor. Stamp duty is actually paid as a levy on documents (
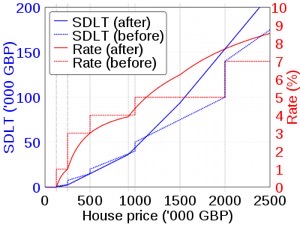
source), and the special form applying in Britain is stamp duty land tax, SDLT, which applies, obviously, to land and property transactions. Rates are on a scale that encourages first-time buyers (no tax below a figure), discourages very expensive housing (the million mark) and second homes (add 3% from 2016).
2nd source.
There is complaint that this raises ‘too much money’ from those campaigning for election. I do not see this at all (and I’ve paid it recently). It seems to me that this is a progressive tax that succeeds; it encourages people to purchase housing (0% up to £125k, 1% up to £250k, it then progressively discourages the market from increase, so that the SDLT on a property selling at just over the million mark is £50k. Arguments that this depresses the housing market cause me to observe that this is what was wanted, a slowing of the market to the benefit of those without houses.
Other attached costs to housing include council tax, but that is to my mind better seen as paying for services, not a tax on ownership.
The cost of moving is not a tax but it is a disincentive to move. Items to include here are fees to solicitor (conveyancer), estate agent, moving company. I predict the first two to come down in price as a feature of progressive automation. In my opinion, estate agents are on a losing wicket and that this market is ripe for a drastic change.
Unoccupied houses:
SDLT applies to second homes at an extra 3%, as above. This could be increased significantly. We’ve just been through this in choosing to sell in Wallsend slowly and discover that the tax is recoverable – that is, it applies to the period in which one owns more than one property. Politically, we need to establish what the problem is, and I think that it is simply one of occupation. A house that is rented is not a social problem – the space is in use. There were 600,000 empty dwellings in England in 2015 (source3):
In early 2014 there were approximately 23 million dwellings in England, of which 63% were owner occupied, 20% were private rented, and 17% were public housing.[35] The overall mean number of bedrooms was 2.8 in 2013-14, 37% of households had at least two spare bedrooms.[7] 20% of dwellings were built before 1919 and 15% were built post 1990.[7] 29% of all dwellings are terraced, 42% are detached or semi-detached, and the remaining 29% are bungalows or flats. The mean floor area is 95 square meters.[7] Approximately 4% of all dwellings were vacant.[7] Approximately 385,000 households reported a fire between 2012 and 2014, the majority of which were caused by cooking.[36] In 2014 2.6 million households moved dwelling, the majority of which (74%) were renters.[7]
Homelessness figures for 2014/5 were 2400 rough sleepers and 67000 households in temporary accommodation. See additional info.
There are a million empty homes in England (source6), 5% of the stock. Mostly this is evenly divided between owned and rented. Diagram at foot.
I can see political success in raising the SDLT on second homes to some significant figure. I see significant gains in taxing empty housing and a target right now (election campaign running) will be housing owned but left empty as investment, especially that owned by non-Brits since they are also non-voters, so all voters will agree that these people pay excess for the privilege of denying space to others. Is there a downside to this, politically? I do not see one. SDLT currently amounts to £11 billion (source, 3rd page). Hunt for yourself here. This also tells you about the activity in the market; for example 2016 had over 200,000 residential sales each quarter.
People want their own residence:
I do, my children do, but that doesn’t mean we should, nor should we expect to. Source5 (for which I can’t steal the diagrams but you can read them for yourself) says that the number of first-time buyers is dropping, from 600,000 per year in 1985 to 200,000 in 2008-11. Rising house prices could partially explain the decline in the number of first time buyers taking out a mortgage, although other economic factors will play a role. From the 1980s until the early 2000s there were typically between 400,000 and 600,000 loans to first time buyers each year. However, in 2003 there was a 31% decline and then in 2008 there was a further 47% decrease—the largest in the series—as the economic downturn affected the housing market.
One should be wary of inexplicit assumptions in the reported figures and you should go read the originals for yourself – you may well be assuming that I’ve read enough, when I know I have not.
I discovered6 some things about the housing stock (2014 report) and I put an abstract in blue at the bottom. It tells you what to call a house but it doesn’t tell you what you want but what there is. It doesn’t tell you what you can or cannot have, nor whether any house in Britain is what we might call good stock – nationall,y we have pretty poor stock in the sense that it is expensive to run.
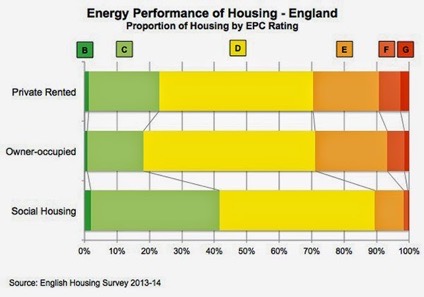
If you use your EPC A-G grading, you can tell what a typical house costs to run. You might modify that to reflect your own usage, and what I failed to find were figures telling me how this changes with age and circumstance, but I suspect I’m asking for far too much in that regard. What would be useful would be an index comparing price (market value perhaps) with running costs. Diagram here from source
6
shows that social housing is of relatively good quality. Personally, I see C grade as achievable and desirable for all of us. Far too many homes are rated D and lower (hence “we have pretty poor stock”), Scotland’s figures are slightly better, having more in band C throughout. Some see a similar
need8; what is needed is for the complete EPC database to
be freely available.
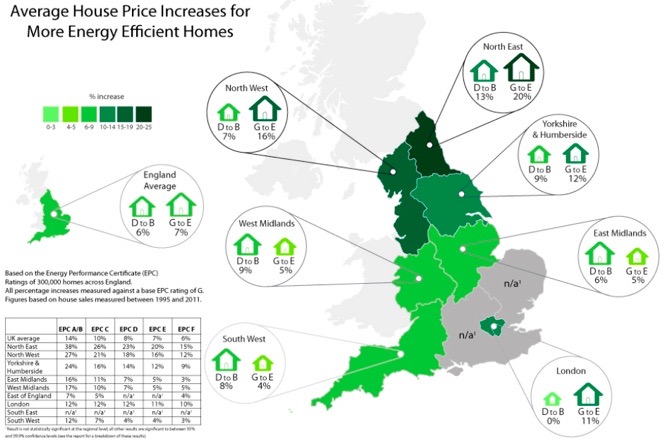
EPC ratings are beginning to have an effect upon perceived value. I am a strong supporter of having the information and it tells me what figure to put on development of a property. Whether any valuer applies a similar thinking I cannot tell. From 9, which is worthy of greater study;
There are certain property attributes that are important determinants of price; size, location and type of dwelling being the more obvious ones. Energy efficiency, although growing in importance, is undoubtedly a weaker determinant in comparison.
There are significant positive effects on dwelling price appreciation per square metre for dwellings rated B, C and D compared to dwellings rated G.
We estimate that, compared to dwellings rated EPC G, dwellings rated EPC F and E sold for approximately 6%, dwellings rated D sold for 8% more and dwellings rated EPC band C for 10% and A/B sold for 14% more.
What is pathetic is the huge volume of housing below grade C7 on the EPC scale. What is similarly poor is the lack of recognition of return on value for making improvements. Successive governments have tried (look, say at the free roof insulation), but with limited success. If we are to upgrade our housing stock in numbers, range and quality, we need some political action that is genuine in its drive for long-term improvement. That calls for unanimity, for which politicians are not well-known. Yet the figures are not in dispute, as far as I can tell, which gives hope that we may at least have a discussion which begins with some agreement.
Changing society’s attitudes requires us to have incentives to change. Brexit might depress the currency and just might eventually cause property prices to drop, but not while demand continues to exceed supply. We need to recognise benefits from efficient use of space, money and energy and we need to encourage ourselves into much better use of these scarce resources. Whether that means that the rich should be in any sense penalised for being able to afford to waste resource is a different matter entirely. I think the test is whether resource is being denied to others and that that is what should be penalised.
DJS 20170504
local mayoral election polling day
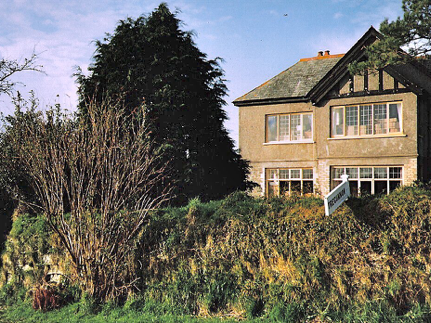
top pic, Tregunnon
I am happy to report that the SDLT I paid for owning two houses has been recovered, six months after reducing back to one residence. My solicitor says I am the first customer of hers to have actually collected. I don’t know that that last tells us anything.
Our new house, new to us, has EPC down at F at the time of purchase. What we sell is a C, as was the one we sold earlier in the year. It will be fun changing an F to a C.
https://en.wikipedia.org/wiki/Affordability_of_housing_in_the_United_Kingdom
3 https://en.wikipedia.org/wiki/Housing_in_the_United_Kingdom do read this!
4 http://www.gov.scot/Topics/Statistics/Browse/Housing-Regeneration/TrendTenure Some Scottish figures
5 http://visual.ons.gov.uk/uk-perspectives-2016-housing-and-home-ownership-in-the-uk/
6 https://www.gov.uk/government/uploads/system/uploads/attachment_data/file/539600/Housing_Stock_report.pdf well worth a read. What I did not find were the gov.uk reports where I can simply copy the diagram – what is on offer is the data itself. Applause.
7 http://www.solarblogger.net/2015/05/how-energy-efficient-is-uk-housing-stock.html
9 https://www.gov.uk/government/uploads/system/uploads/attachment_data/file/207196/20130613_-_Hedonic_Pricing_study_-_DECC_template__2_.pdf
Again, well worth reading.
Additional Displays:
from 3:
from
4
;
from
5
see the mix-adjusted house price index here:
House Price Index - February 2016 (Table 22), ONS
from 6
see the mix of vacant dwellings here, fig 1.6.
Average usable floor space is 94 square metres. Around 31% had less than 70m2 and 39% had at least 90m2 of usable floor area, Annex Table 3.1.
On average, the size of England’s 2.4 million smaller terraced houses was 64m2 in 2014. Larger terraced houses had an average floor area of 101m2; this average was higher than that found among semi-detached homes (96m2). The usable floor space of just under half of larger terraced houses were between 70 and 89m2 (47%) and over half (53%) had at least 90m2 of internal space, Annex Table 3.1
While the average available floor area of semi-detached homes was 96m2, the size of these homes varied greatly; 14% had less than 70m2, 43% had between 70 and 89m2, and 43% 90m2 or more. Detached homes tended to be the largest, with an average 147m2 of usable floor area. The majority of these homes (88%) had at least 90m2 of usable floor space.
On average, bungalows had larger floor areas (77m2) than small terraces (64m2) and had a lower proportion of the smallest homes (less than 70m2), 53% compared with 70% among small terraces.
The average sized flat was 61m2, slightly lower than the average for small terraced houses. Flats were most likely (75%) to have less than 70m2 of internal space compared with all other types of homes. Only 7% of flats had over 90m2 of internal space.
Overall, over half of English homes (54%) had five or more habitable rooms while 8% consisted of two or fewer habitable rooms.9 Most of the smallest homes (of less than 70m2) had three habitable rooms (40%). For medium sized homes (of 70-89m2), just over half (53%) had five or more habitable rooms, whereas 90% of largest homes (over 90m2), had at least five or more habitable rooms, Annex Table 3.2.
Small terraced houses most commonly (46%) had four habitable rooms (the traditional two up two down) while around one quarter (24%) had five or more habitable rooms. In contrast, around three quarters (73%) of larger terraced houses had five habitable rooms or more. The findings for semi-detached houses were largely similar to those for larger terraced homes, Annex Table 3.2.
The vast majority of detached houses had five or more habitable rooms (93%). Most commonly, bungalows had three habitable rooms or fewer (39%), 30% had four habitable rooms and 31% had five or more of these rooms.
Roughly one third of flats (34%) had two or fewer habitable rooms and just under half (45%) consisted of three habitable rooms.
Small terraced houses most commonly (59%) had two bedrooms.10 Not surprisingly, larger terraced houses tended to have more bedrooms than smaller terraces; 62% of larger terraces had three bedrooms, and a further 23% had four or more bedrooms. A similar overall pattern was seen for semi- detached houses; 69% had three bedrooms and 18% had four or more bedrooms, Annex Table 3.3.
Most detached homes (63%) had four or more bedrooms, reflecting their larger size, while 50% of bungalows had two bedrooms. Just over half (51%) of flats contained two bedrooms, 39% had one bedroom and the remaining 10% had three or more bedrooms.
Owner occupied homes were generally larger in size; with average usable floor space of 106m2 compared with 77m2 for private rented homes and 67m2 for social sector homes. This difference by tenure was observable among all dwelling types except for small terraced houses, Figure 3.3.
Overall, owner occupied homes were most likely to have five or more habitable rooms than rented homes of an equivalent size, Annex Table 3.5.
Among the smallest homes (less than 70m2), the proportion with four or more habitable rooms was notably higher in owner occupied homes (44% compared with 31% of private rented homes and 21% of social sector homes). Owner occupied medium-sized homes of 70 to 89m2 were more likely to have five or more habitable rooms (58%) compared with roughly half of rented homes (47% of private rented and 45% social rented).
The vast majority (92%) of the largest homes (90m2 or over) that were owner occupied had five or more habitable rooms compared with the equivalent sized social sector (79%) and private rented homes (84%).
7 Passing from D to C means, for most of us, taking steps to provide renewable energy, either by having solar panels of either type or by recovering energy from elsewhere, such as using heat pumps to extract heat from flue gases or from under the garden.
The things you are likely to be told to do, in order of effectiveness are:
- •Insulate the roof up to 250mm, probably paid for by the state, but that will only be done in the easily accessed bits, while the EPC surveyor will look at the places where that wasn’t done (all those little lean-to extra roofs that house grow like carbuncles)
- •Cavity insulation, also funded by the state. issues in places with extreme weather, as the cavity is there to keep a gap between skins of brickwork and so rain that penetrates the outside skin is supposed to drain down the inside face of the outside wall, then out through the perpends (I don’t need to look any of this up). Bridging the cavity helps any water in that cavity to move to the inside skin, which gives you unwelcome wet patches and cause for complaint. Hell to fix.
- •Replace ALL the lights with low-wattage things. Very cost-effective; the EPCs i have read carefully suggest that the first year spend will be recovered in the next year. However, we tend to use more lights in the ‘new’ scheme, and we don’t make energy conservation a target. Issues with the heat going past the new bulb and subsequent other heat losses. Lesson: be clear what it is you are replacing: bulb? Cheap, effective. The whole light? Spend a lot more or you’ll undo the good you think you’re doing.
- •Under-floor insulation. Not fun to do, since the headroom is usually far less than you want. Not cheap in terns of time, nor particularly cost-effective, because (i) the wooden joists can’t be covered, since then they’ll get rot and (ii) because you did the most effective stuff already. It is quite tempting to replace wooden floors with solid floors incorporating heating. or move house, which doesn’t fix the national problem, but fixes yours. We need more incentive from the state.
- •For many of us this is now the High Ds, but those with pre-war housing will, I reckon, need to do even more wall insulation inside or outside. Much longer return, since you’ve done so much already. Unless this is recovered by the market putting a value on the EPC, and unless this nudges you from D to C, you may not see enough return to justify it.
- •Now you’re about to step across a boundary. Solar panels of either sort (see essay 218). If the Feed-in tariff still applied, this step was more effective than the last.
- •Further still, do both of the panels AND then go for energy recovery. Look up domestic RHI; your talking heat pumps recovering heat from flue gases or stealing it from under the garden, or changing your boiler over to biomass. These work if (i) you are capital rich but not income-rich (ii) you’re doing lots of other building work at the same time (iii) you have loads of space (which may mean space of the right kind).