
Whilst writing the previous essay about the gym I found a few items new to me about heart rates and decided to separate the content, since the whole was so long.
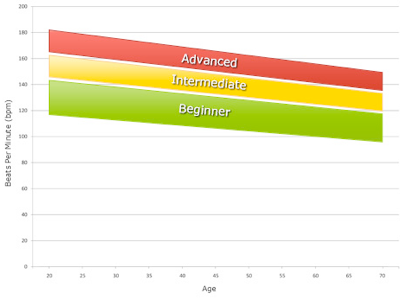
Going back to the gym briefly as a source of context, many of the aerobic exercise machines, cycler, skier and runner, invite you to input age and weight; many of these same machines will monitor heart rate. If I am honest, inputting 59 and 70, then what happens is the machine won’t let me play (at all, sometimes; at other times they act like a fuse is blown and fail to provide resistance). So I tell them I’m 35 and 70 and they allow me to play. There’s a commonly seen graph that shows heart-rate and training zones. There are two examples shown here.
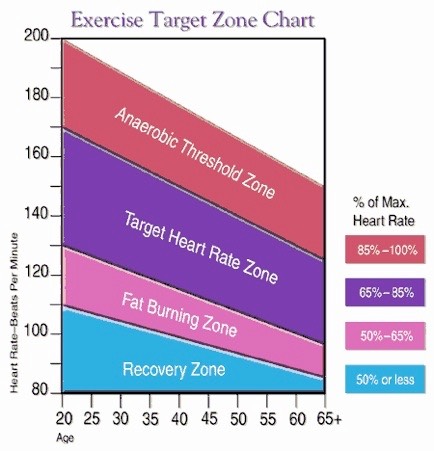
Both say I’m daily off the top of the scale. At age 50-55 I regularly finished a run at 190 bpm and sustained 160 for lengthy periods. Training in the gym at PMC would include 20-30 minutes at 165. In Beijing (I’m 60 this year) I’m comfortable at 155 and less so at 160, with 165 being something I won’t hold for five full minutes. But then rowing (back in the mid 70s) used to get (all of those in the boat) over 200 bpm in any race. Which is to say, perhaps, that racing is not the same as training.
What we’re supposed to do is take 230¹ and subtract age. At 230 itself I’ve lost vision steadily as the blood won’t reach the brains properly and the body starts shutting down; I’ve had this happen in squash, where the ball was in a reducing circle of light, and in rowing where I lost sight entirely (and we broke a race record). We take our age from 220 these days (comment suppressed). If we’re being posh about this, we compare 220-age with our resting heart rate, also called basal heart rate and HRrest. I’m on² 160-50=110, C is on 190-70=120. This number is called heart rate reserve, HRR, HRmaxR. Training is supposed to then occur between 60% and 80% through this interval, so at 127±11 for me and 154±12 for C. In practice C trains at 170±10 and I train at 155±10. We’ll call these the training zone, for now.
Those who are twitching to write and tell me we’re being stupid (for example because I’m well into the ‘here be dragons’ part of the graph) need to wait just a moment.
The graph I am shown so often shows % heart rate and advertises 220-age, but it misses out the bit that says the % is of the working interval. The graph above confuses this. My theoretical max, at 220-age is 160 and at 230-age is 170. I’ll agree that the practical upper limit is in that interval. My 90% ceiling is then not between 144&153 but between 149 and 158, with which I agree entirely; 158 is what happens in a good workout.
Runners’ World makes a point that many take % of maximum heart rate (that 220-age thing), not the % of the working range. Wikipedia (and the PE colleagues that I spoke with) says (below) this is a matter of history and advertising. If I do the same training zone arithmetic as above then I get 153 instead of 158 (okay, I’m happy with either).
D C
220 or 230-age ceiling 160-170 190-200
90% training limit 144-153 171-180
(220-age) 60-80% 96-128 114-152
HRR 60-80% 116-138 142-164
HRR 90% 149-158 178-187
actual training 145-165 160-180
Looked at that way, it may be that many folk have misunderstood with what numbers they’re supposed to be doing percentages. One more time: what we’re supposed to do is apply % figures to the training zone range, not across the whole 220-age range.
Having realised there is a confusion, I went looking to see what I could find on the topic and discovered a whole range of models. The wikipedia entry on Heart Rate tackles what I wanted to know directly, but may not address what others want to know.
The 220-age formula is reported thus: Although attributed to various sources, it is widely thought to have been devised in 1970 by Dr. William Haskell and Dr. Samuel Fox.[11] Inquiry into the history of this formula reveals that it was not developed from original research, but resulted from observation based on data from approximately 11 references consisting of published research or unpublished scientific compilations.[12] It gained widespread use through being used by Polar Electro in its heart rate monitors,[11] which Dr. Haskell has "laughed about",[11] as the formula "was never supposed to be an absolute guide to rule people's training."[11]
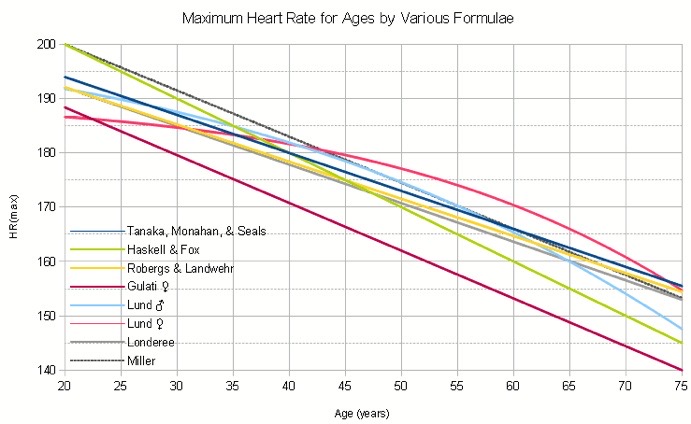
This graph from wikipedia, link here. It comes from a meta-analysis (research based on looking at the available research) by Tanaka, Monahan and Seals. Copying content from wikipedia, they showed that HRmax is strongly (r=0.9) correlated with age and this checked with the lab work they did, giving the formula HRmax = 208-0.7(age). Hence my HRmax is 166 or 167, with which I am comfortable, as it puts 95% at the 158 line I declare as crossing from the usual training discomfort into some red (race) zone. Tanaka et al showed that HRmax to be independent of gender and independent of wide variations in habitual physical activity levels.[9] ³, ⁷
Other formulae shown on the graph are, using the same colours, 220-age, 205.8-0.685(age), 206-0.88(woman’s age), 203.7/(1 + exp (0.033 x (age - 104.3))), 190.2/(1 + exp (0.0453 x (age - 107.5))), 206.3-0.711(age), 217-0.85(age).
Some of the studies indicate their standard deviation; the precision used suggests a lack of (understanding of) deviation or a level of misquoting. The wiki article points out that individual variation is large, see ref 11 below (I kept the wikipedia numbering there). Even within a single elite sports team, such as Olympic rowers in their 20s, maximum heart rates have been reported as varying from 160 to 220.[11] Such a variation would equate to a 60 or 90 year age gap in the linear equations above, and would seem to indicate the extreme variation about these average figures.
This suggests to me that, as Runners’ World puts it, maybe the figure isn’t what’s important, but how you feel at the time. Turning that around a little, given that the measurement is easily available, one should adjust what one does with the information on a personal individual basis. That might make for some bad training decisions made by coaches who believe what they’ve read as having far narrower bands of variability. The report of 2002, [12, below] concluded that there were no formulae that adequately predicted VO₂ nor prescription of exercise training HR ranges. That same study’s formula is the most acceptable (maybe, least unacceptable) and has a 6.4bpm std dev (which means that 95% of cases will be within two such units of the figure, up to 13 units offset). Runners’ World also discusses training years, which is a way of saying that this is what your body is used to doing; newbies shouldn’t expect to handle the workload that long-timers do, though both will be susceptible to injury if they’re not suitably careful. Those are my words, or they would be in a colour.
Discarding—with some difficulty—the writing arguing with the 220-age formula⁶, but recognising a higher degree of variability than I was expecting to occur, it looks as though what I call training is operating at 85-100% of the target training zone. I’m not comfortable over 160bpm and will agree with that recommended ceiling during training. C has far fewer training years (I have at least 45 when writing) and works within 75-95%. I looked at Runners’ World⁷ on the subject, here; they suggest that max is found by actually doing some running, three mins hard, three slow and three hard. The peak will be towards the end of the second set. I went and found out; I can sustain 160-165 for a lap of the track, suggesting that 165-170 is my current limit; that makes a lot of sense of their other descriptors, where they describe 85-90% as 10k pace [153±5] and 90% as 6x800m aiming for 90% in each repetition. 90% of 120+50 is 158, which is what I’d be doing with that many repetitions. Repetitions would wait for 70% of heart rate, [0.7x120+60], 144 for me, where what I’ve done for years is wait for 140 and go. Waiting for 120 only takes a little longer. Back in 1970 the ‘go’ was at 160 for 200m intervals, but 140 for 800m repeats. ⁸
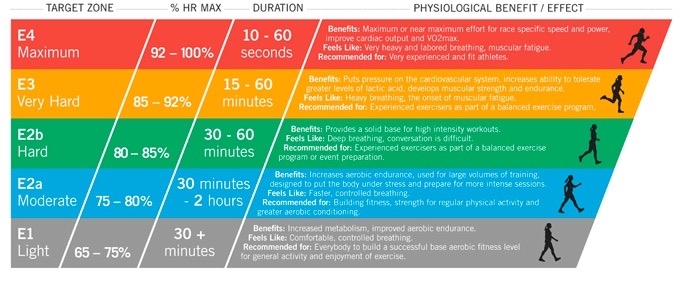
If you’re planning to do a long race, let’s say over an hour, then I don’t see how preparation at 80% of race state is any help at all. I found a site called mastersathlete that refers to heart rate states 1-7; Zone Six is where you go faster than race pace with long recoveries, raising intensity but reducing volume; good for increasing VO₂max, tolerance to lactic acid and improving endurance speed; what I’d call a ‘track session’. Zone 5 is at 85-90% of HRmax and would describe interval training or 20-60 minutes ‘hard’. Probably what I call “going for a run”, then. Zones go down another 5% each time, so 4 is 80-85%, 3 is 75-80% and 2 is 70-75%,. Zone 1 is then the recovery zone. Zone 2 has a nice definition as ‘conversation pace’; I’ve applied this to myself in half-marathons for a long time (since 1995 perhaps) as a way of ensuring I keep the first (half, but that proportion increasing with years) slow enough.
The Masters Athlete site goes on to say, Speed training for the aging athlete is far more important than it is for the younger endurance athlete for a number of reasons. First, aging athletes tend to train with decreased intensities, suggesting that the fast twitch b-fibers (the pure speed fibers found in large amounts in sprinters) are not activated at any time. If they are not activated, they decrease in size and possibly number—use it or lose it—and lead to decreased muscle size, thus muscle strength, and thus speed and power. Secondly, aging muscles that are used to contracting slowly as a result of slow training over longer distances, forget to turn over fast when in a race. Speed work (e.g. 3-20 second all out-efforts with long recoveries) done in short bursts once to twice a week depending on the training phase, can help the aging muscle and nerves to fire quickly. Thus, when faced with racing at a slower than sprint pace, the muscles can cope. Two or more days of recovery at low intensity zones are needed to recover from these sessions as muscle damage is likely. Measuring heart rates during or at the end of all-out sprint work. However, they may be useful to see when you are recovered enough to sprint again. I think the last two sentences are confusing; do you?
For the aging endurance athlete, the vast majority of training should be in zones 2-4 with spikes of zones 5-7 depending upon the training phase.
More speed training called for, clearly, since that is where zone 7 is; gloves not just off, but mislaid.
DJS 20130531
Snippet spotted on master athlete: Research suggests that heart rates increase by 1.4% for each degree above 21 degrees Celsius. For example, at a constant pace, a heart rate of 140 at 21 degrees will become 160 at 31 degrees. Noted and observed already down in Guangdong. Nice to have people agree. See Essay 63 - On Hydration. The calculation doesn’t bear extension ‘outside the data range’ as we say in Statistics lessons and does need a limiting range announced.
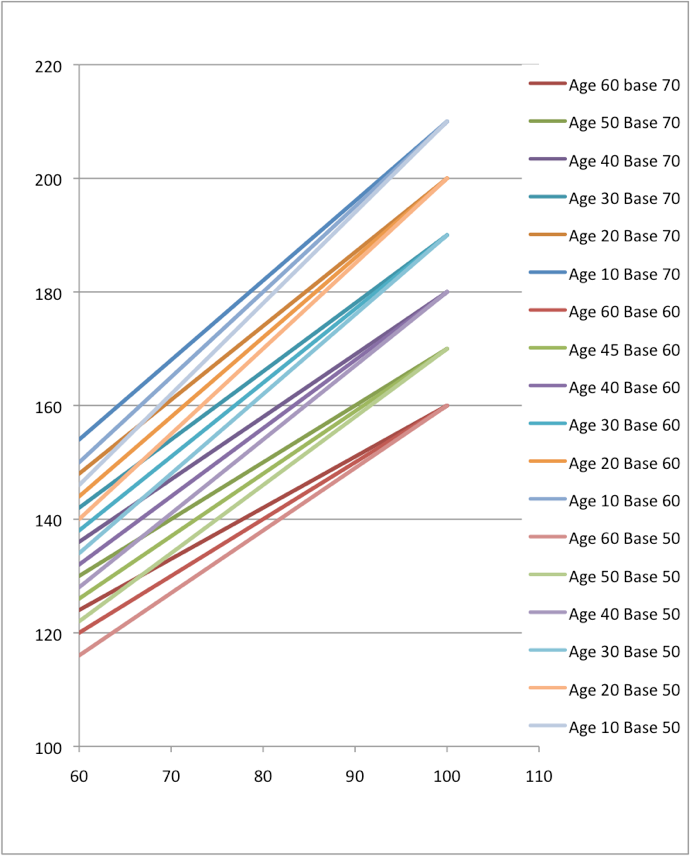
Here’s a diagram I’ve made based on the Runners’ World figures: Y-axis is heart rate, x-axis is % of training zone. The barchart below that comes from the Performance Training Institute and relates to those same percentages. Repeating: What I’ve done is stick with the 220-age thing and then taken a % of the training range.
DJS 20130525 Heart rate and training zone .
1 230 - age was the rule of thumb in the 70s. Called the age regression formula, I find no-one recording the 230-age version we used when rowing in Cambridge in the mid-70s. Further, the 220-age rule is not only widely found on gym machinery, it is built into curricula (plural) in ways that mean arguing with the rule is likely to cause professional pain on the grounds of dissent.
2 The technical term for a non-sleep resting pulse below 60 is bradycardial. Martin Brady has the 2005 world record for the lowest heartbeat, 27. Compare this with Miguel Indurain at 28. [Indurain was a pro cyclist with 5 Tour de France wins; he had 7 litres of blood oxygen, a lung capacity of nearly 8 litres, his VO₂ max was 88 ml/kg/min.] Mad cyclist pal Sean gets down to 30bpm.
3 Tanaka et al showed that HRmax to be independent of gender and independent of wide variations in habitual physical activity levels.[9] Well, that kills off any suggestion of merit in the idea of training years, don’t you think? Maybe not, if the ‘training years’ idea is limited to how close the the ceiling you get when training. That has been my observation, that how close I can get to the perceived ceiling is the dominant feature of increasing age. I have written about this often in describing running; I feel that a very small increment in speed pushes me into a zone of discomfort that feels like damage and imminent inability to sustain that pace. I think of this as running at capacity: it can’t be called ‘flat-out’ since a higher speed is available for a short time, but then one is genuinely running on empty and into some sort of negative gain.
4 Intensity being the adjectival noun describing how hard one is working in a session, based on the % mark in the training zone between basal heart rate and maximum heart rate. Basal rate of 60, maximal of 180, gives you a 120 bpm range, where 95% is 60+120*.95=174. See my big graph, above.
5 I was reading the talk part of wikipedia, which suggests that endurance athletes have a slower decay in maximum heart rate (than other groups of folk). It says that basal heart rates of 50 apply more widely than we may commonly discuss (a good thing). I found a writer agreeing (appearing to agree) with me about recovery rate being the fall in % of maximum heart rate.
6 Maximum heart rate is a topic which finds Edwards’ formula; 210-0.5(age)-5%(bodyweight) plus 4 for males. The wiki talk says 1%. Weight is in pounds, so use 210-0.5(age)-11.2%(bodyweight) plus 4 for males if working in kg. It just might be bodyweight plus 4 before the multiplication. That puts my upper limit at 177, a bit higher than I wish to explore this year, but experimentation is imminent. I moved the apostrophe on Edwards to the right place.
Sally Edwards takes issue with maximum heart rate altogether. See “Ten Reasons Why ‘220 Minus Age’ Is Just Plain Wrong,” in Sally’s blog. I agree with everything she says (oh, I’m so easily swayed). She even puts a name to the conversation test, attaching Carl Foster’s name to what I deem logical and obvious, if a little difficult to measure with precision. It is the 60-70% zone, zone 2, in which you can talk. Comfortably.
7 The wiki site gives labels to these approaches and calls the Runners’ World distinction the Karvonen method, quoting the formula as THR = ((HRmax − HRrest) × % intensity) + HRrest where it is agreed that heart rate reserve, HRR, is HRR = HRmax − HRrest, entirely as I described it originally. The Karvonen study is criticised for ignoring the correlation between VO₂ max and HRR (some room for dispute, there), but I’d say personally that HRR is easy to measure and VO₂ is panting - you soon know if you’re unfit to continue a training regime. Surely the idea is to use training to improve matters and that better information makes for better training in a feedback loop. That makes any science a source of encouragement to work more smartly, not to inflict damage.
8 If I assume I’m 10 years younger than the calendar says then the 220-age figures make sense again. Yes. I’m slowing down, but not by as much as some of the formulae say. Perhaps one should be measuring the immediate speed of return to a low target? I discussed this earlier and I have long said that this is what fitness ought to mean, knowing that it needs a defining adjective or two (aerobic fitness, aero-cardial fitness). I postulate a decay index, being the time it takes to drop bpm by say 25% of the training range (so for me from 155 to 125 might give something useful for interval training), but then we’d mean dropping from 95% to 65% of the intensity⁴. Alternatively, decay would be the % drop from an arbitrary upper figure (95% again preferred by me) across a minute, but that assumes that a minute is shorter than the expected recovery time for interval training, else it’s not a lot of use.
I have experimented recently (early June 2013) and it takes around 60 seconds for the pulse to fall from 160 to 130 on the treadmill, which represents having run at 16+ kph for a nominal track lap (or an equivalent with the incline turned up) and the wind-down may be a slow jog at between 6 and 10kph, though dropping the last 5 takes the last 20 seconds. Repeating this over two weeks improved the recovery rate and I went from 165 to 135 regularly in 45-50 secs, happy to go again at 135. This is continuing walk/jog at around 6 kph during recovery. Going from 150 to 120 was 75 seconds and again the last few, 130 to 120 are slow. I could actually stop to lower the demand level, but that would free up the machine...
small edits 20130814
9 Tanaka, Hirofumi; Monahan, Kevin D; Seals, Douglas R (2001). "Age-predicted maximal heart rate revisited". Journal of the American College of Cardiology 37 (1): 153–6. doi:10.1016/S0735-1097(00)01054-8. PMID 11153730.
11 Kolata, Gina (2001-04-24). 'Maximum' Heart Rate Theory Is Challenged. New York Times.
12 Robergs R and Landwehr R (2002). "The Surprising History of the "HRmax=220-age" Equation" (PDF). Journal of Exercise Physiology 5 (2): 1–10. ISSN 1097-9751. Retrieved 4-1-09.
