
I have been wondering increasingly what the future is for the motor-car. Or perhaps I mean the future of personal transport. This first effort is side-tracked into public expectations about speed.
A long-time fan of Top Gear, despite the laddish behaviour (we can be sure they get man-flu), I am confused by their continual pursuit of speed. I agree with James May when he criticises design based upon research at the Nürburgring but delight in ‘handling’ and yet I wonder far more often what the point is in having a car that does any speed in three figures imperial. I see the point in good 0-60 figures, I appreciate the fun element of a car that can be flung at corners and I well remember the thrill of riding a decent motorbike. But the world we live in is a PC painted green¹. Much driving is in the newer straitened circumstances that don’t require much thought at all and might soon be better (safer and possibly quicker) managed by the in-car traffic system than the proven incompetent at the wheel. Already we have issues with ‘ordinary’ two-lane non-urban road traffic from people who otherwise only do urban and motorway driving: this is that driving where the speed limit is 60 (“National Speed Limit”, 60 for cars) and accounts for 70% of fatal accidents.2,3. Our motorways really are surprisingly safe per travelled mile, but please note that is not how the figures are presented. Pedestrians have to be present to be injured, so inevitably there are few on motorways and many on urban minor roads. I tried to find a correlation of accidents and road speed⁴; what I learned is that;
Accident frequency increases with mean speed ^2.5, so a 10% change in mean speed gives a 26% change in all injury accidents. Other factors are the density of sharp bends (sharp enough to have a sign) and the density of minor crossroad junctions. These increase accidents by 13 and 33% respectively per additional hazard per kilometre. Single vehicle accidents are dramatically affected by extra bends, at 34% per additional hazard per kilometre.
Accidents are far more likely on ‘difficult roads’ [Group 1⁵], those with hills, bends and a low traffic speed. Accident ratios with the four classes of road were 12:6:4:3. Reducing speed by 3% reduces accidents by 10% [1 mph at 27 mph mean gives 9% accident reduction, one at 60 gives 9%]. Change of speed has a big effect on serious/fatal consequences but less so on the incidence itself. This is not surprising; what may be is the factor; a 10% increase in speed implies a 30% increase in fatalities. Read ⁴ for yourself.
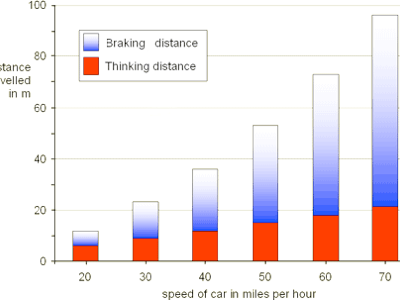
Stopping distance is made of thinking time and braking time. The old highway code figures were in feet and mph and can be viewed as a simple algebra model I used to use in lessons⁶. A modern car will behave differently, maybe changing the model wholly to thinking time/distance being half the whole. Road conditions make a huge difference: In a modern car I suspect that the driver is the bigger problem, and what we should be asking is “At what speed will you be travelling at the moment of impact?”. Apply this to the idea included within the very cynical “At 30mph you’ll only kill half the people you hit” and you head towards the far more sensible question hidden within questions such as “What changes occur within the injury statistics with 3mph at 30mph?”. Which may make you behave differently in the built environment. Evidence at ⁷. Suffice for the reader who ploughs straight on that, as a car stops quicker (better, shorter, more effectively, whatever the weather) so the thinking time component becomes more significant. The Highway Code figures assume 0.68 secs from identifying a problem to pushing the pedal; the Australian figures use something more like 0.42; design of cars has changed, not the people doing the driving. ABS doesn’t really stop you a lot faster, but it gives you steering while you’re stopping. A modern car under poor conditions will not achieve even the figures in the code, while under good conditions it will perform extremely well.
I came across the term ‘marginal speed’ recently, meaning in the context given, doing a bit more than the speed limit. The example given was someone who had an accident, doing 38 in a 30 limit. I didn’t think this was ‘marginal’, myself, but the cogent point was the speed still to lose at the point when a car at the speed limit would have stopped. Doing 38 in a 30 means you’d still be at 28mph at the expected stationary point; even at 33, there’s 15mph residual speed⁸. You might run that fast. Rarely, I expect. Point here is that if you have a speed difference with something you might hit, you need more space than you might think. May this inform your driving safely.
My point? A modern car goes well and stops well. It gets up to speed and down from speed better than its equivalent fifty years ago⁹. Our roads are far better than then, but more crowded. The roads are better both in design and materials, but we aren’t. Well, we are a little, as the campaigns to make us drive only when clear-headed (sober, not on drugs, etc) have effect. The nanny state gives us low speed limits to allow the population to make bad mistakes to small effect. I support 20mph zones, but I also support pushing the motorway speed up. At the same time I am very aware that for many people the 60mph limit is near their own capacity limit on rather more roads than we might at first think. The safety figures tell us that. However, I disagree with the blanket assumption that all speeds should be lower. Yes, it is additional speed that turns a casualty into a death, but that doesn’t mean that all speed kills all people, while it certainly means that inappropriate speed might well kill you (or worse, someone else)¹⁰.
Is driving fun any more? I don’t think so, but I try to find places where it may be.
Given this situation, I’m going to look at development of transport for the next few of these essays.
DJS 20150309
Looking ahead, have you seen the stable motorbike, with stabilising gyros so it doesn’t fall over, even when stationary? – it is in effect a two-wheel car. Bikes in 157 or click the Next at the top of this page. Car developments in 158
Fuel sources are an issue, so I shall look at alternative fuels - 159.
I shall look at alternative engines – electric, steam
To round off I think I ought to look at alternatives choices of personal transport – walking, running, cycling. Perhaps the future holds far less travelling simply by doing steadily more on the ‘net from home. In which case we face some bigger social changes.
Oh, incidentally, get past the idea that mass has anything to do with braking. Not true.
For balance, there’s this from a Danish study, sent to me by Adam Blair (Talex.co.uk)
The Danes have just released results of a 2 year study on two way rural roads, where they increased the speed limit from 80 km/h to 90 km/h. In the study, accidents on the roads tested reduced.
On sections of motorway where the speed limit was raised from 110 to 130 km/h nine years ago, fatalities have also decreased.
What the Danish road directorate discovered was that the traffic that had been traveling below the speed limit sped up a bit, and those who previously broke the speed limit were less tempted to break the 90km/h one.
To begin with, the Danish police were not keen on the idea...
Erik Mather, a senior Danish Police Traffic officer, said: "The police were perhaps a little biased on this issue, but we have had to completely change our view now the experiment has been trialled for two years." There is other evidence that not treating drivers like automatons who should blindly obey signs works in terms of safety. In European cities where all "road furniture" and signage has been removed in urban areas, drivers have been found to automatically slow down when they can see pedestrians, cyclists and children may be sharing the same space as them.
I think what’s obvious from the Danish experiment is that if you remove frustration from a driver’s immediate experience, they will drive more considerately.
1 I found many photos tinted green.

This s much better. http://www.techfresh.net/lawnpc-makes-earth-greener/
Mind, I wonder how many modern kids think ‘Keep Off the Grass’ refers to their smoking habits?
2 That quoted figure doesn’t fit with there having been 661 deaths on 60 limit roads and 612 on 30 limit roads in 2011. Of that 612, 233 were pedestrians - unless I’ve misunderstood the figures. All have been dropping steadily, looking at 2005-11.
3 Deaths per billion miles travelled (by everyone in UK, I think): 125 motorcyclists, 41 pedestrians and 4 car occupants. See here and here, 2011 figures. See 2013 figures, I suggest table ras30018. In per billion vehicle miles travelled on the 2013 figures; total deaths are 452, rural/urban 342/781 and M/A/Other 85/472/642. So M/ways are very safe and non-A road far less safe (8x so). Unsurprisingly, the ‘user casualty’ figures are high with speed [e.g 137 /billion for M’way] and pedestrian casualties rise as soon as their presence occurs [208/billion miles on non-A urban roads].
4 http://www.safespeed.org.uk/TRL511.pdf See this paper for the four classes of road, page 18
5 Group1: Roads which are very hilly, with a high bend density and low traffic speed. These are low quality roads. Group2: Roads with a high access density above average bend density and below average traffic speed. These are lower than average quality roads. Group3: Roads with a high junction density, but below average bend density and hilliness, and above average traffic speed. These are higher than average quality roads. Group4: Roads with a low density of bends, junctions and accesses and a high traffic speed. These are high quality roads.
6 Speed v (mph). Thinking time turns into a thinking distance t (feet). Numerically, v=t. Braking distance b feet, is v²/20. Total stopping distance is S= t+b = v+v²/20 So v=20, t=20, b=30 S=40; v=70, t=70, b=4900/20=245, S=70+245=315. If you look this up in wikipedia you will find that the constants have been cleverly picked to make the numbers easy to remember. Subsequent revisions translated feet to metres, so the thoroughly metric version (kph, m) is roughly S=v/5.28+v²/170= 0.189v+v²/170. That’s a deceleration of about -2/3 g.
I found video of a fast BMW braking from 120mph in under 5 secs, which is 10.7 m/s/s, -1.1 g and under superb conditions. The f1 car beside it managed more like -3g.
We have to learn something about this for the test. Is it relevant? Yes, in the sense that you ‘must’ hold some figures that show stopping is related to the square of the speed. if your car stops much better, that doesn’t change the relationship and it most certainly shouldn’t mean you can drive faster because ‘you won’t hit it’, except in those circumstances where you have changed your speed to fit the road you can see (Should you be able to stop in what of the road you can see? Surely in general, yes).
7 http://www.something-interesting.co.uk/?p=45 braking from 70mph in 25m (car+1) and 41 metres (car+2)
http://www.edwardtufte.com/bboard/q-and-a-fetch-msg?msg_id=0000Yn includes a discussion of problems akin to what I do too from David Nash. One contributor points to the coefficient of friction varying from 0.2 (wet pavement), through the US federal standard of 0.83 to a rare 1.1. David Nash found some Australian figures. Reading the numbers shows an inconsistency at 60mph and, even allowing for this, suggests only a small change with speed; converting speed in kph to distance in metres I get 0.4v+v²/180.
Staying with metres and kph, compare this with the current highway code’s S=0.1865v+v²/176: awesome reaction time compared to Oz and slightly improved braking. Don’t confuse these metric versions with the mixed unit v+v²/20 above, which converts to 0.189v+v²/170.
8 If we use the standard figures then 38mph takes 35ft longer and at the zero mark the remaining speed would be 26.5 mph. At 33 not 30 one would still be exceeding 15 mph. The difference between 80 and 70mph done this way is 85ft, being a ‘zero point’ speed of 41mph. You can use s=v+v²/20 (s feet, v mph) for two speeds to find the residual distance ∂s and then √(∂s*20)=∂v, the residual speed at the zero point. The mixed units aren’t affected, though you may be surprised at this. Thinking about 20mph zones, you’d expect to be stopped in 40ft from 20, so doing 30 leaves you, scarily fast at a 20mph zero point; over 26mph. Even doing 25 leaves you at 15mph. Put that another way, if someone acted on the assumption that traffic was doing 20mph in line with the posted limit, at every speed over 26.1 mph you’d still be over the limit at the assumed impact point. Boggling. My figures; I may write a maths page about this. I have done.
9 Evidence? Take a 1969 Ford Capri 2000 GT, 0-60 in 10.6 secs. My boring (a Top Gear comment) A3 takes more like 9. A Jaguar XK [3.4] from 1954 took 11 secs; the 2011 XF [3.0 diesel] 5.9 secs. My RX-8 did it in 6.4 (often under 7), my Suzuki 400 1976 in around 6.5 (hard to check that figure, but a 2008 Yam 250 takes 6.7). 2018: My less boring Audi Q3 takes an official 6.8, still ⅔ of the racy Capri from 1969.
10 Don’t be stupid. of course killing someone else is worse, for it leaves you to face the music, the family and the consequences; for the rest of your life, such as it might be. If you are the one killed from your own misadventure, then, allowing an “Oops” as you realise what’s about to happen, you don’t much care any more, do you?
