

If you want to know about air pollution in Britain visit one of DEFRA’s sites, such as this, which publishes what has been collected most recently and shows where the detector is. If you zoom in to a particular region you can see there is a lot of detail available; so much so that it is quite hard to get a picture of what is going on. I hunted through the PM2.5 figures for Newcastle this year and found occasional highs close to 60 – as bad as it gets, there. Most of the figures were under half of that, looking among the daily maxima. The current levels can be found and the information is good in that you have a measurement and a rating, typically ‘Low’.
What do we measure? DEFRA measures a lot of things, but the most fuss is made over the NOx and SOx, the ozone and the particulate matter, PM2.5 and PM10. We discussed some of this in the last blog <link>. Monitoring stations generally measure CO, SO₂, NO₂, O₃, H₂S and particulate matter, particularly (ha!) PM2.5 and PM10 The PM units are micrometres (microns). These are small enough to stay in the lungs. I don’t like the sound of that. [ppb = parts per billion, ppm = parts per million and µg/m³= micrograms per cubic metre.] The ozone makes people sick, probably because it is created when poisons react in sunlight; it is probably the poisons that make people sick, not the ozone itself, since we celebrate exactly the same ozone stuff when at the beach. Carbon monoxide is created from inefficient burning and is directly poisonous, reacting with haemoglobin. Nitrogen oxides are all bad for us, but the dioxide irritates the lungs (making nitric acid) and leaves the red-brown colour in the atmosphere. Hydrogen sulphide and sulphur dioxide also come from burning, burning coal and oils heavy in sulphur and the results, in wet air, continue to make things bad [chemist and medic response please]. Both the NOx and SOx produce acid rain; noxious and soxious.¹ AQI refers to the air quality index for a particular pollutant. AQHI relates to the pollutant and its associated health risk.
Looking at the detail of, say, the PM2.5 I found that a bad figure for Britain is around 60. One of those foggy days in early November (the 6th was a bad day) produced temporary roadside highs at many stations, none over 60. The measuring stations are sited ‘kerbside’, which seems to mean in the roadside verge. This then means it would measure what you’d collect on a bike or walking. One wonders if it is at all cleaner inside a vehicle, but we accept that this is a local pollutant in that the figures fall away quite quickly as you move away from the road. Implicit in this is that PM2.5 is generated (mostly) by car motors. ¹ Particulate matter (PM) is a term used to describe the mixture of solid particles and liquid droplets in the air. It can be either human-made or naturally occurring. Some examples include dust, ash and sea-spray. Particulate matter (including soot) is emitted during the combustion of solid and liquid fuels, such as for power generation, domestic heating and in vehicle engines. Particulate matter varies in size (i.e. the diameter or width of the particle). PM2.5 means the mass per cubic metre of air of particles with a size (diameter) generally less than 2.5 micrometres (µm). PM2.5 is also known as fine particulate matter (2.5 micrometres is one 400th of a millimetre). Source. One of the reasons for looking closely at this measure is that it includes the secondary particles of NOx and SOx reducing these gases reduces PM2.5 figures. While urban traffic accounts for only around 14% of the total (same source as last), roadside measurements will be the highest for any locality and this local maximum then becomes the figure to reduce. So we’re not talking about averages, mostly, but the worst local measurement.
What do these pollutants do to you? Back to the DEFRA site: here and here
Inhalation of particulate pollution can have adverse health impacts, and there is understood to be no safe threshold below which no adverse effects would be anticipated [1]. The biggest impact of particulate air pollution on public health is understood to be from long-term exposure to PM2.5, which increases the age-specific mortality risk, particularly from cardiovascular causes. Several plausible mechanisms for this effect on mortality have been proposed, although it is not yet clear which is the most important. Exposure to high concentrations of PM (e.g. during short-term pollution episodes) can also exacerbate lung and heart conditions, significantly affecting quality of life, and increase deaths and hospital admissions. Children, the elderly and those with predisposed respiratory and cardiovascular disease, are known to be more susceptible to the health impacts from air pollution [2]. Potential mechanisms by which air pollution could cause cardiovascular effects are described in the Committee on the Medical Effects of Air Pollution (COMEAP) report “Cardiovascular Disease and Air Pollution” (2006) (PDF, 1.75MB, 215 pages).
Poor air quality is a significant public health issue. The burden of particulate air pollution in the UK in 2008 was estimated to be equivalent to nearly 29,000 deaths at typical ages and an associated loss of population life of 340,000 life years lost [1]. It has been estimated that removing all fine particulate air pollution would have a bigger impact on life expectancy in England and Wales than eliminating passive smoking or road traffic accidents [2]. The economic cost from the impacts of air pollution in the UK is estimated at £9-19 billion every year [3]. This is comparable to the economic cost of obesity (over £10 billion) [3].
Wow. Significant, then.
DEFRA: The main pollutants of concern in the UK are particulate matter (PM), oxides of nitrogen (NOx), and ground level ozone (O3). This briefing is concerned mainly with fine particulate matter (PM2.5). This is the pollutant which has the biggest impact on public health and on which the PHOF indicator is based. Information on other pollutants is available from the .GOV.UK website.
As I’ve written already, the NOx and SOx form various acids when in contact with damp lung tissues and so irritate (at the least) and generally degrade breathing. Ozone is “good up high and bad nearby”: ozone is created in sunlit reactions with NOx and volatile organic compounds (VOC). Breathing ozone triggers a variety of health problems because it is an oxidant, so it irritates the airways. Like other irritants this will create a burning sensation, shortness of breath and aggravate all existing conditions to do with breathing. All of these affect the young, the elderly and those with existing breathing conditions. Add to that group all the vigorous training athletes, whose heavy breathing exaggerates all the effects and brings them into the damaged groups. Sources: several US sites, such as from EPA).
So PM2.5 is a suitable measure to worry about. It is not the whole story by any means, but it simplifies the situation. For a complete picture you need to look at all the figures and you might well identify a local issue to worry about, such as SOx from dirty shipping diesel in Shanghai or mercury from a coal-fired power plant reaching you in fish.
Is the pollution only outside? Should we crawl into our caves and hide? What makes you think that the air outside is different from the air inside? Well, it depends how you live: solid fuel fires make your local indoor conditions really bad, and makes it worse if ventilation is poor. sources. Generally, improving ventilation relieves indoor pollution, but there is an assumption that the outdoor environment is ‘cleaner’ than the indoor one. See. In the US the estimate is that the indoor environment is 2-5 times worse than the outdoor one, so investigation is called for at a personal level. The solution, as supplied by the American Lung Association is ‘eliminate and then ventilate’.
It would be rare for the indoor air quality to be better than the outdoor one. Such occasions would be found in one of the big cities with pollution problems, such as Delhi, Beijing, Mexico City, Moscow and several more in Pakistan and Bangladesh. Those able to do something for themselves will look at air filtration. Three sorts are worth consideration: trickle ventilation (a screen filter in an open window), air conditioning (takes out the water-borne pollutants, plus some of the particles) and a HEPA filter (aimed to remove the particles). See.
______________________________________________________________________________
When a typical figure for air quality in Britain is 30 (μgm-3 PM2.5) the similar figure in Beijing is 130. A bad day in Britain is 60 and one in Beijing is 400. Actually, by then the AQI figure is misleading since the scale is irregular. See blue diagram in DJS’ essay 104. To see today’s air quality in Beijing, see bjair.info or aqicn//beijing. At the time of writing where I lived in Beijing has 199 and Newcastle 25. Meanwhile New Delhi has 254 (and 615 AQI), Kashi 317, UAE 256, Hyderabad 157, Incheon South Korea 120, Moscow 78, Chennai and Mexico City 85. Go to AQICN.org/map and zoom out on the map [Jess: screenshot in drop box]. Theses figures are AQI not PM2.5 concentrations, so the relationship is not straightforward once we leave Britain. The figures obviously depend on there being transmitting sensors.
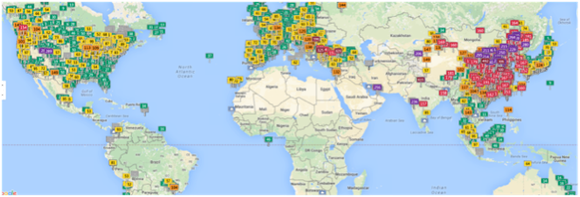
There are some interactive pollution maps to play with:
http://epi.yale.edu/pollution-map/
http://www.citylab.com/weather/2015/09/mapping-the-worlds-air-pollution-in-real-time/406411/ looks the same as aqicn to me. http://waqi.info may be the source.
http://www.worldmapper.org/textindex/text_pollution.html a different presentation
I dislike the maps that paint a whole nation the same colour, though I suppose pollution could be a reflection of the political climate. Painting all of China and India as heavily polluted doesn’t reflect the large expanses in both countries that are pollution free.
______________________________________________________________________________
While I found several sites telling us that air quality has worsened in the last decade, I suspect that this is a feature of actually having measurements. One might look at the EPI site: Air quality has gotten worse over the last decade, and for more people. The 2014 Environmental Performance Index (EPI), a biennial global ranking that compares countries on high-priority environmental issues, shows that over the last decade, the number of people breathing unsafe air has risen by 606 million and now totals 1.78 billion. That’s one quarter of the global population. 2016 advance report.
DJS 20151110
in draft
top picture from apis, Air Pollution Information System, using lichen to assess nitrogen pollution effects; NOx and NH3
1 That PM is produced by mostly by diesel is not something I thought to check. However. this document, Non-exhaust traffic related emissions, says It is estimated that exhaust and non-exhaust sources contribute almost equally to total traffic-related PM₁₀ emissions. It points out that, of course, as diesel emissions are better controlled, so the proportion of particulate matter from non-exhaust sources—which means tyres, brakes, clutches and the roads themselves—increases. So electric cars DO produce particulate matter emissions, just not from the power unit. This may need to become a separate essay. Until it does understand that:
About half of what is produced by the non-exhaust components of particulate pollution become airborne. Brake wear is estimated to contribute approximately 16-55% by mass to non-exhaust traffic-related emissions. Clearly disc brakes ‘emit’ more than drum brakes.
Brake emissions are of both particulate sizes PM2.5 and PM₁₀. It depends on the brake pad material, but there is a worrying amount in the very small particle category. This provides strong argument against vehicles mixing with people. There are not enough studies of this to be certain of conclusions beyond that some of the particles are too small to measure and there is a lot more of this than previously thought. Most of the work on this is German.
Tyre wear goes where? […} approximately 10-30% of its tread rubber emitted into the environment. Heavy vehicles have more tyre and produce around ten times what a car does; road surface has an effect - concrete is better than tarmac (but we don’t stop as well). One has to wonder at other sources of particles, general and localised. A lot of the rubber particles are large; less than 10% is airborne (disputed) but a result is that what you might call old dust can be thrown up subsequently, so tyres may well account directly and indirectly to 30% of the mass non-exhaust emissions. Results are variable. Generally, it is the smaller particles that travel airborne.
DJS 20181206
Remainders:
What is the pollution indoors if it is higher outdoors? Apparent answer, at least as bad as outside, unless the air infiltration rate is particularly low. In ‘western’ society, it is likely that the home is a source of pollutants worse than outside. In Asia, it is possibly the other way about.
What is the effect that says a pollution event creates something like asthma? Is this some sort of allergic reaction? This prompted by Simon Evans' response to Life of Breath blog entry. What induces sensitivity? See. The immune system produces antibodies when first exposed to an allergen; this may cause sensitisation but not reaction, unlike subsequent exposure. Immunotherapy aims to de-sensitise by injection of tiny amounts of the allergen (it’s not quick; 3 years is a typical course).
Causes of asthma attack (bronchospasm) - anything that irritates the lungs, including allergens, irritants, exercise and even emotions.
hygiene hypothesis Over the past 20 years there has been a rise in allergies, and no-one really knows why. Around one in four people in the UK suffers from an allergy at some point in their lifetime and numbers are increasing every year. Research suggests that exposure to germs is only one possible reason for this and diet, lack of exercise, our environment, use of antibiotics and a family history of allergies may play a bigger role. Not an argument to be less clean, really, but to find those ‘old friends’ germs; which might explain why fewer asthmatics live on farms (not because asthmatics don’t farm, because living an a farm somehow protects you from becoming asthmatic). Perhaps it is access to farm animals? Evidence of links to allergies found in antibiotics, change in childhood diets (breastfeeding is good) but not personal hygiene, cleaning products, vaccines.
IFH 2012 report on home hygiene: The summary sets out the key findings and conclusions from the review. The Hygiene Hypothesis, originally postulated in 1989, proposed that a lower incidence of infection in early childhood, transmitted by unhygienic contact with siblings, could be an explanation for rising levels of allergic diseases. It was suggested that this “infection” exposure no longer occurs because of higher standards of household and personal cleanliness - that “we have become too clean for our own good”. New knowledge is now challenging this interpretation. Although microbial exposures are vital for immune regulation, the “Old Friends” hypothesis suggests that the required “exposures” are not to infectious diseases (IDs), but to environmental, and human and animal commensal microbes. This concept has now also been applied to a range of disorders such as multiple sclerosis, type 1 diabetes and inflammatory bowel disorders. New data suggests that the altered exposure results from measures vital to protecting us from IDs, but which have inadvertently reduced or altered exposure to the microbial friends that regulate our immune systems. These include food and water quality, sanitation and environmental cleanliness together with medical advances such as antibiotic usage. Since the need for infection prevention through hygiene is as great as ever, we need to tackle both issues – reversing the trend in CIDs and reducing the burden of ID. There is need for clearer communication about the hygiene hypothesis and guidance on how to target hygiene practices effectively where and when they are required. The full report is entitled “The Hygiene Hypothesis and its implications for home hygiene, lifestyle and public health” and can also be downloaded from this website.
Don’t confuse AQI numbers with PM2.5 concentrations in µg/m³. See Essay 104 or wikipedia. “a piecewise linear function” as wikipedia accurately describes it. For conversions, look here.
Other links:
https://books.google.co.uk/books?id=TNEr8G4vqRUC&pg=PA9&lpg=PA9&dq=if+air+pollution+high+outdoors,+how+bad+is+it+indoors?&source=bl&ots=QJ1otpwAyt&sig=zfSsLdql9YIGBCExhiBcdM5yHRw&hl=en&sa=X&ved=0CBsQ6AEwADgKahUKEwiI7vaM1oXJAhWFIQ8KHYqBA8k#v=onepage&q=if%20air%20pollution%20high%20outdoors%2C%20how%20bad%20is%20it%20indoors%3F&f=false
