
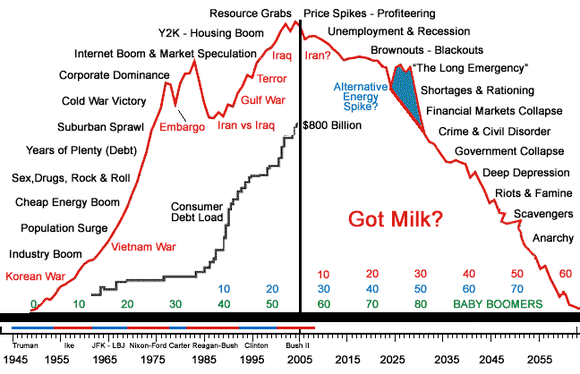
Peak Oil is a term used to describe the maximum rate of oil extraction. The term applies to a well or a field or to all oil sources amalgamated. For a single well, the curve looks like this one (M King Hubbert, 1956), though he was writing about global oil. The curve is changed by discovery (exploration, finding other sources, bringing them ‘online’) but closely follows what is now called a Hubbert curve¹. You can’t pump oil if it isn’t found (I prefer available, a little more then just knowing it is there).
I discussed this as a House Assembly—one of my tests for essay topics—way back in 2003, at about the time I moved into school as a full-time resident, but felt my effort largely wasted. Students from then are welcome to tell me differently, but I expect they switched off at the doom-and-gloom aspects, instead of switching on to a career opportunity. I read Alex Scarrow’s book (ref below) last week (no, it didn’t take me a week to read it, it was one of five) and this prompts me to take pains to explain and explore the topic more fully.
Jake Gordon’s site cites National Geographic, June and an Independent special and his dissertation of April 2004 can be found here, perhaps. Taking just one line: “The conclusion is simple: full employment and high energy consumption cannot be sustained. The death of industrial capitalist society as we know it is unavoidable.”
The problem is that the casual observer sees that there is a maximum and makes conclusions such as
(i) there’s half left (half? why?)
(ii) there’s a lot left (fine, it does look like that)
(iii) there’s 40 years left (not my problem, then).
So what might be wrong with those ideas - the idiocy of the first, so common one, that says the only number between 0 and 1 is 0.5, is sufficiently covered; stupid, stupid. The problem is not what there is left, it is how fast we are using it. There’s a measure of reserves/production, which assumes that demand insists that production continue at the same level (particularly no decrease in production). That is taking no account of the cost of extraction (rising, we found all the cheap oil long ago), nor that we passed ‘peak pressure’ long ago.
Now I recognise that one tends to find data that support one’s targeted argument; if I’m chasing “We have a problem” rather than “Do we have a problem?” I will come up with different choices. Instinctively I think we do have a problem, but then I fear the whole world is refusing to look at all sorts of problems – supplies of oil, energy and water and over-population are immediate and ever-present issues of concern. I might add rising water levels, religious nut-case issues, the decline of science and an inability to think logically: those points might be inextricably linked, but I don’t think the water levels are caused by religion, more by (or with) the thermodynamic principle that waste heat is the end result of energy conversion processes. I found a rose-tinted scenario written here, titled ‘the risks of abstract logic’ and copied (in brown on my machine) below.
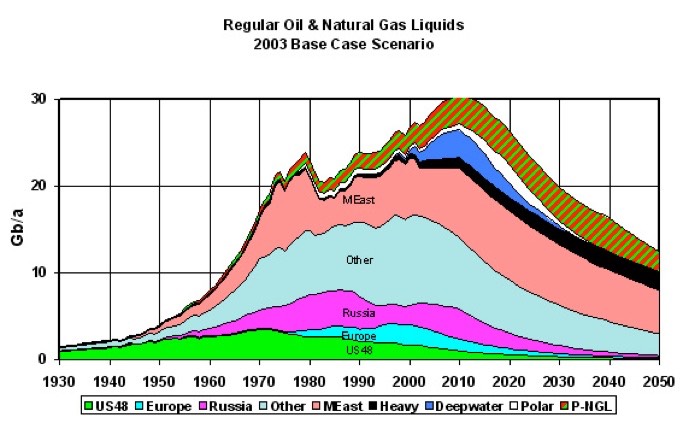
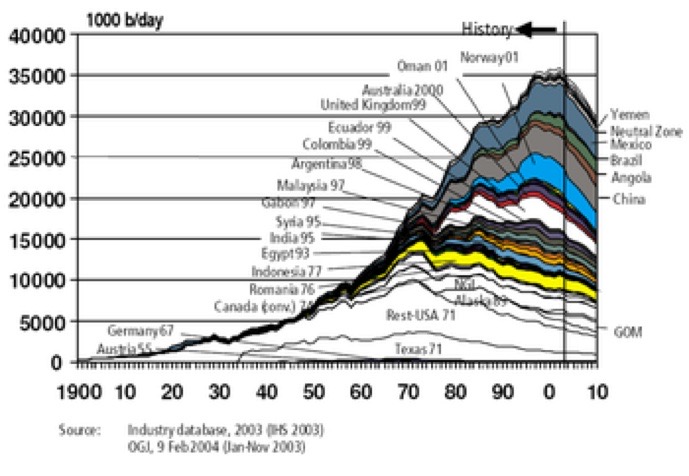
This Base Case Scenario says what, quite? It may say not much more than that we have found the easy oil. It shows a peak at 2015. The area under the graph is oil volume; that’s obviously less than half the total, consumption continues to rise and we have no obvious moves to reduce consumption, against many demands for increases.
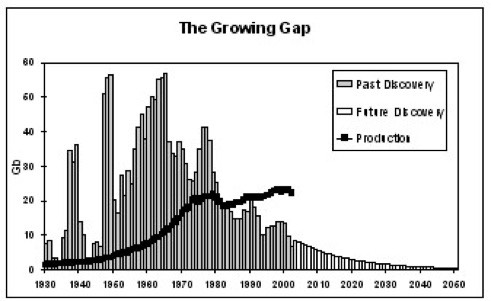
The Growing Gap (right), also PeakOil Newsletter 38, Feb ’04, and the wiki site) says that peak oil went by some time ago. It shows production well above discovery. It doesn’t forecast, but it does point to a problem.
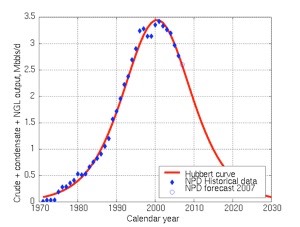
Contrast that 2003 graph above with the one below from 2004 (wikipedia and as shown, titled 'US government predictions for oil production other than in OPEC and the former Soviet Union' and so implying that there’s lots more not shown):
Y-axis is Mb/day, where the 2003 image shows Gb/year, so a factor of three [1000/365] needs to be included, if they are indeed comparable. This 2004 graph should connect with the thick black line on the 2003 graph - it doesn’t fit, to my eye. Yet another case where the picture says a 1000 words but if you want the real story, you want the words and more.
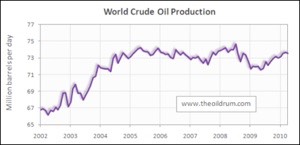
Looking for recent considerations, principally on peakoil.net, I find comment “oil production has been flat since 2005”³ meaning no increase. From the same article is a diagram showing ‘flat’, plus the same Growing Gap diagram, a little updated.
This essay³ points to a growing population that means that peak oil per head was back in 1979. Oops. The absolute peak in 2012, possibly back in January, but it may have been 2006⁴. The same essay³ refers to ‘net energy’ but uses ratios. Net energy gain, NEG, measures the gain in energy by counting the gain over the energy spent in acquisition. So oil in the 1930s cost one barrel of oil to extract 100 barrels, 100:1 ratio. In 2011 the US ratio for oil is 11:1. The tar sands that people have been excited about yield at a ration of 3:1. There comes a point when there is stuff left but we spend too much delivering it for use. 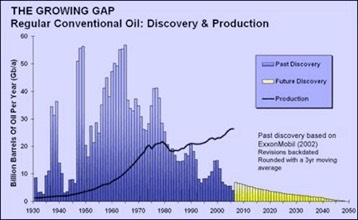 “An Amish farmer gets 10:1 net energy with hand tools.” How do you work that out?
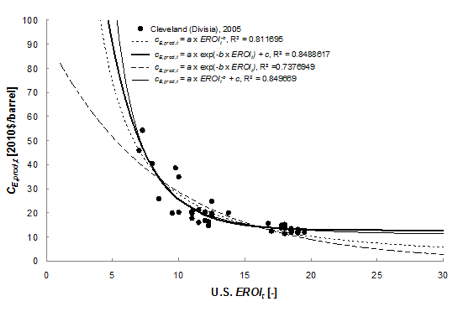
EROI = Energy return on investment⁵, abstract of paper below defines the principal term as energy returned to society divided by the energy required to get that energy. This then can be given as a dimensionless ratio. As the paper says, don’t confuse this with converting energetic forms, such as turning coal into electricity. They go on to define varieties of EROI; societal, point of use, extended. Follow Charles Hall to know more - but wouldn’t I like that work or something similar. Picking selectively from that work, it would seem that we have about 20:1 worldwide for oil in 2009. Looking at trends in that number implies that 2030-40 is when we spend one to get one.
I looked at the figures and chose one graph to give an idea of the variability in such a comment; the same figures might say we’ll stick at an EROImm of 10:1, and the basis is only for the US. Point, then, that below 10:1 in the US is significant to the rest of us?
There are several problems; not least the access to information. The problem of energy supply is a complex balance between demand and supply and the simple truths are that we will decrease demand if the price goes high enough, that the competition for energetic resource is enough to go to war over – probably costing so much energy the cost will be measured in decades lost to whoever is left afterwards, and (I need a third, oh yes) we will run out of oil and coal and gas long after we cannot afford to extract them.
One table compares the cost of delivering (a) gasoline or (b) corn-based ethanol to the user, using what it calls extended EROI. I summarise:
The US want 36 units (billion gallons, but we don’t care much what the unit is) of ethanol delivered to pumps. It will cost 111 units or equivalent fossil fuel at the farm gate (ethanol is farmed, wake up) to deliver 36 units to the customer. That’s 75 units in delivery, so EROI>3 is required to avoid ‘subsidy’ by fossil fuel. That appears to be difficult.
Energy delivered/invested gasoline, diesel 4.14 corn-based ethanol 0.5
Conclusion: Thus by the time a fuel with an EROImm of 10:1 is delivered to the consumer—that is after the energy costs of refinement and blending, transport, and infrastructure are included—the EROIext is 3:1. This means that twice as much oil is used to deliver the service than is used in the final-demand machine, and since most of our oil is used in transportation, including trucks and tractors, it is probably at present a reasonable number for the entire oil chain in our society.
That 3:1 ignores all of the society we ‘enjoy’, all those things that don’t contribute to getting resources but we call ‘society’, like entertainment, all those services like health care and education. We need to fix this or life isn’t worth living.
DJS 20120914
1 Start from dy/dt = y(1-y), the standard growth curve (growth depends on what there is and what is left, target growth unity). That gives y = (1+et)-1. If your target is h then rewrite this using proportions; let y=x/h and dx/dt = x(h-x), (check that!). This is the distribution function for the Hubbert curve, so differentiate and you have what I show next. CIE FM Stats has a use!!![]()
The Hubbert Curve is a ‘symmetric logistic distribution curve’, distinct from a gaussian function. Taking from wikipedia yet again I give a specific equation for the curve. I agree that we would expect a bell-shaped curve, but I’m surprised we’re not assuming Normality. I’m satisfied that the peak be symmetrical but question the assumptions behind that choice. The curve is produced in a sort of self-predicting way by requiring that the curve be bell-shaped (hence the divisor term, (1+ae-bt)² with the maximum (a single maximum is required) as the numerator, let’s say Ke-t. You don’t have to play with this much (or² maybe you do; try it) to see that the year of maximum production is b-1 ln(a), that you can force K to be unity, but K is the total recovered (resource, oil in this case).
I think this may belong in my economic modelling section. I am surprised not to find lots of argument over the requirement for symmetry of the model; I am surprised to see a meek acceptance of the modelling thinking. Why is the curve not skewed negatively to reflect demand outstripping supply? The symmetry presupposes a replacement energy source always being available. Yet if we looked at total energy demand, surely a skew is required (until we reduce demand, or population, or both)? Obviously (well I think it is obvious), we would need to sum a series of curves to model multiple events - but the underlying assumptions are not being questioned. There are parallels with cash-flow modelling; summing curves is ‘easy’ in computing. A partial answer to my issue here is that, as wikipedia puts it: A post-hoc analysis of peaked oil wells, fields, regions and nations found that Hubbert's model was the "most widely useful" (providing the best fit to the data), though many areas studied had a sharper "peak" than predicted.
2 not squared, foot note. I did the differentiation and had an extra ln(b-1) I couldn’t get rid of. So I tried different thinking: The assumption that the curve is symmetrical requires the peak to be when t= b-1 ln(a), hence xmax = K/4 e-1/b . Please check that and tell me you do or do not agree. A ‘plot’ of the Hubbert curve puts 0.25 as the peak, assuming all constants to be unity. We can choose t=0 as the peak to confirm that the peak is at xmax =K/(1+a)², so if a=1 this is K/4. You might (please) make comment before I try to turn this into a Maths page.
3 see here.
4 “In April 2011, chief economist of the International Energy Agency Fatih Birol revealed what the industry knows: "We think that the crude oil production has already peaked, in 2006."
5 What is the Minimum EROI that a Sustainable Society Must Have? Charles A. S. Hall *, Stephen Balogh and David J. R. Murphy is a downloadable file, www.mdpi.com/1996-1073/2/1/25/pdf Here’s the abstract:
Economic production and, more generally, most global societies, are overwhelmingly dependant upon depleting supplies of fossil fuels. There is considerable concern amongst resource scientists, if not most economists, as to whether market signals or cost benefit analysis based on today’s prices are sufficient to guide our decisions about our energy future. These suspicions and concerns were escalated during the oil price increase from 2005 – 2008 and the subsequent but probably related market collapse of 2008. We believe that Energy Return On Investment (EROI) analysis provides a useful approach for examining disadvantages and advantages of different fuels and also offers the possibility to look into the future in ways that markets seem unable to do. The goal of this paper is to review the application of EROI theory to both natural and economic realms, and to assess preliminarily the minimum EROI that a society must attain from its energy exploitation to support continued economic activity and social function. In doing so we calculate herein a basic first attempt at the minimum EROI for current society and some of the consequences when that minimum is approached. The theory of the minimum EROI discussed here, which describes the somewhat obvious but nonetheless important idea that for any being or system to survive or grow it must gain substantially more energy than it uses in obtaining that energy, may be especially important. Thus any particular being or system must abide by a “Law of Minimum EROI”, which we calculate for both oil and corn-based ethanol as about 3:1 at the mine-mouth/farm-gate. Since most biofuels have EROI’s of less than 3:1 they must be subsidized by fossil fuels to be useful.
DJS 20120914
Reference Sites all from the first page of Googling Peak Oil:
http://www.peakoil.net Dedicated to discussing the issues surrounding the supplies of fossil fuels.
Peak Oil: The End of the Oil Age www.oildecline.com/ - A problem that will soon eclipse Global Warming. Time estimate, Consequences, Preparation, Financial Aspects, Strategic Relocation & News.
http://en.wikipedia.org/wiki/Peak_oil Peak oil is the point in time when the maximum rate of petroleum extraction is reached, after which the rate of production is expected to enter terminal decline.
BBC News - Shortages: Is 'peak oil' idea dead?
www.bbc.co.uk/.../science-environment-1835396 19 Jun 2012 – In the third of a series of five essays on declining global resources, Roger Harrabin examines whether the world can wean itself off a declining ...
Hubbert Peak of Oil Production
www.hubbertpeak.com/ 12 Jul 2012 – Provides data, analysis and recommendations regarding the upcoming peak in the rate of global oil extraction. Work by various experts on the ...
Peak Oil: a brief introduction
peakoil.org.uk/ In early 2004 I heard about peak oil and have been researching the issue since. My dissertation for my sociology degree can be read online, with the title No ... Jake Gordon, in the UK, 2004.
12 Jul 2012 – Provides data, analysis and recommendations regarding the upcoming peak in the rate of global oil extraction. Work by various experts on the …
top image taken from here,
books to read as novels: Alex Scarrow, Last Light and perhaps the sequel Afterlight.
311. The Risks of Abstract Logic [PeakOil Newsletter #38]
Jules was an intelligent young man with a pleasing personality. He had completed his higher education at Louvain University in Economics and Logic, which he combined with a fertile imagination. He had had little difficulty in passing the entrance examination to the Directorate of Research of the European Commission.
His first task had been to react to complaints from an animal rights organisation about the cruel treatment of pigs on their way to market. He had no prior experience of this subject but armed himself with a pig-breeders handbook from another department in the Commission. He read about the hormonal growth additives given to the pigs to improve their economic performance, but inspiration came to him sitting after lunch in the little garden he had discovered round the corner from his office in the Boulevard Woluwe, when a butterfly alighted on the flower bed at his feet.
On returning to the office, he started writing his report, complete with many graphs, tracking distance to weight versus growth rate and sty occupancy. His solution was the addition of a synthetic butterfly hormone whereby the pigs would grow wings and be able to fly to market. Apart from the humanitarian benefits, the scheme showed impressive economic returns. His supervisors were delighted with the report, enabling them to assure the pig industry that they could now answer the concerns of the animal rights campaigners, and look forward to increased market share from aero-euro pork. A check with air traffic control classified the programme as being within the dirigible Directorate.
That happy outcome made him a natural candidate to cover the next difficult issue facing the Commission, namely security of oil supply. He went to work with enthusiasm to develop a comparable model solution, whereby rising prices would stimulate both new discovery and improved recovery, which sounded eminently logical. By this means, he was able to lift the expected ultimate recovery from the consensus of 1.93 trillion barrels from 65 published estimates by oil companies and knowledgeable institutions up to the year 2000 to an impressive 4.5 trillion by 2030. In some uniquely favoured areas, as much as 70% would be recovered, despite the diversity of individual reservoir rocks and oil types so far observed in all oil producing areas. The ample recovery was further supported by reference to a study by the US Geological Survey, giving a very wide range of estimate under alternative subjective probability rankings, that sounded impressively scientific being the result of 50000 iterations of simulation.
He refined the study further by considering OPEC, having near limitless resources, and Non-OPEC where limits were countered by intensive exploration yielding new discovery. A slight shadow of concern did flit across the page about OPEC’s willingness to supply, but he overcame that by saying that it was outside the scope of the study. (It has now been published by the European Commission under the title: World Energy, Technology and Climate Policy Outlook - acronym WETO).
He fully deserved his promotion. He had helped his supervisors push that problem into the future, when the possibility of miracles of biblical proportions could not be denied. Meanwhile, Business as Usual was assured, as the sun shone with new intensity above the Rue de la Loi.

