
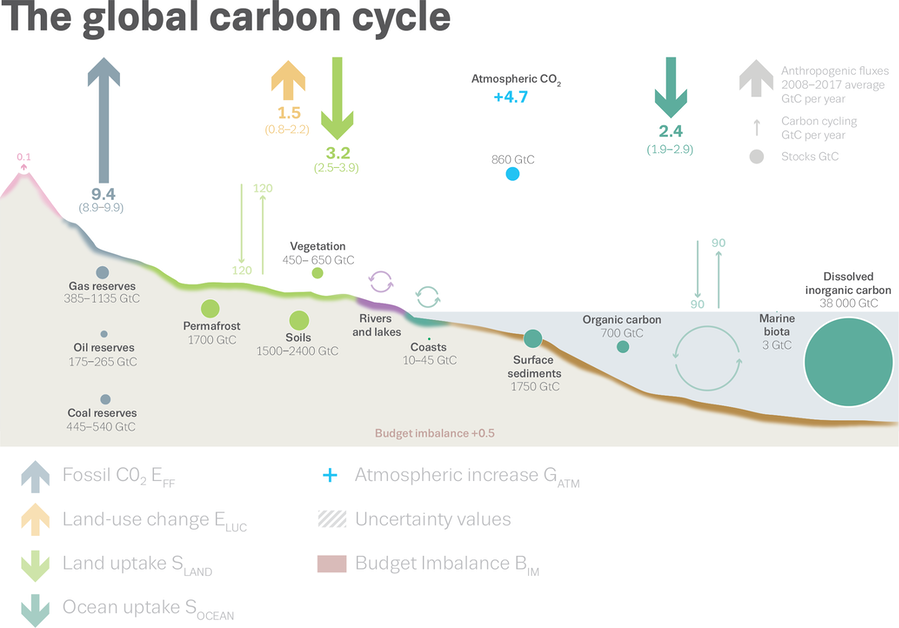
Top pic: Schematic representation of the overall perturbation of the global carbon cycle caused by anthropogenic activities, averaged globally for the decade 2008-2017, from Price and Warren 2016, via [5]. GtC is gigatonnes of carbon. legend in grey top left.
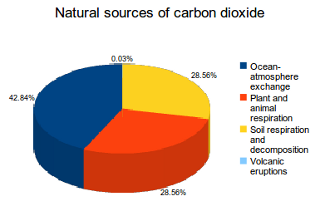
We think of CO₂ as 'bad' because it encourages the greenhouse effect, raising the planetary surface temperature. While water vapour is the main feedback gas, it is removed from the atmosphere within a week because it is part of the climate system. The gases we make more fuss over are called 'forcing' gases because they take a long time to be removed from the atmosphere and because they encourage the greenhouse effect. We make a fuss about CO₂, CH₄, N₂O and the several fluorinated gases. These gases come from two general sources; natural processes and human activity. The natural processes include gas exchange with the oceans, plant/animal respiration and decomposition. ¹
While the reporting says several times that the human-produced (anthropogenic) CO₂ is small in comparison to the natural total, it is the effect of that additional amount that is causing the climate to change. It is not the small ⅙ % we add, but the cumulative effect of an additional percentage every year that gives rise to the problem. You can too easily imagine someone like President Trump disregarding a ⅙% as trivial. ²
Tying the numbers down to appreciate the problem is difficult, partly because there is so much information to wade through. Source [5] to the rescue.
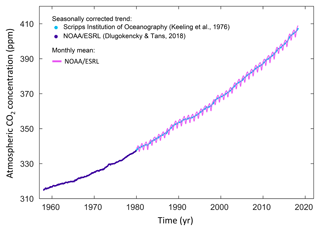
The concentration of carbon dioxide (CO2) in the atmosphere has increased from approximately 277 parts per million (ppm) in 1750 (Joos and Spahni, 2008), the beginning of the industrial era, to 405.0±0.1 ppm in 2017 (Dlugokencky and Tans, 2018; Fig. 1).
So that says that across 250 years we have added 46%, almost half as much again as the figure from 1750. The graph with the purple line below and right is from {5]. ³ As yet that curve is still steepening—the second derivative is positive— when we need dramatic change to have any hope of reducing the gas levels in an absolute sense. When people write about carbon capture, the objective is to move the carbon (from CO₂) from the atmosphere, preferably in some long-term way. More precisely, the objective is to move the carbon to a part of the cycle that moves slowly. Q1.
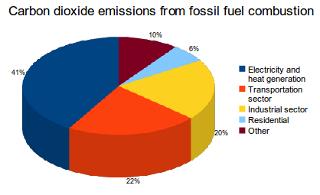
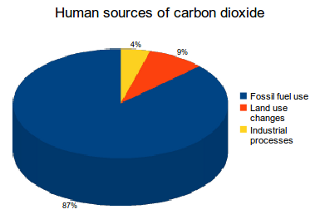
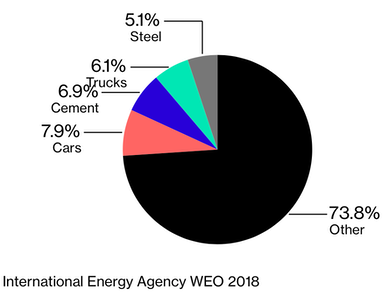
Historically, the bulk of our effect is from change of land use, where deforestation not only results in large amounts of burning but releases that CO₂ previously locked up in the trees. Since about 1950 the dominant source of anthropogenic emissions to the atmosphere has been from burning fossil fuels, which has continued to trend upwards. One of the pie-charts to the right shows recent (2011?) distribution of fossil fuel consumption. it seems to me obvious that the fossil fuel burning process moves carbon from where it was sequestered, underground, to the atmosphere.
Unsurprisingly, some of the natural processes for carbon capture succeed, An obvious component here is what is held in the ocean (besides a lot of plastic waste, that is). It is unsurprising to learn that measurement of this is not only difficult but unreliable, in the sense that there is significant variance in the numbers generated from measurement. The considered opinions in [5] measure gigatonnes of carbon per year, GtCyr⁻¹, producing comments such as this: The terrestrial CO₂ sink increased from 1.2±0.5 GtC yr⁻⁻¹ in the 1960s to 3.2±0.7 GtC yr⁻¹ during 2008–2017, with important inter-annual variations of up to 2 GtC yr⁻¹ generally showing a decreased land sink during El Niño events (Fig. 6), responsible for the corresponding enhanced growth rate in atmospheric CO₂ concentration. Q2
..and this ... growth rate in atmospheric CO₂ level increased from 1.7 ± 0.07 GtC yr⁻¹ in the 1960s to 4.7 ± 0.02 GtC yr⁻¹ during 2008-2017 with important decadal variations (Table 6 and Fig. 2). Both ocean and land CO₂ sinks increased roughly in line with the atmospheric increase, but with significant decadal variability on land (Table 6), and possibly in the ocean (Fig. 7). The ocean CO₂ sink increased from 1.0 ± 0.5 GtCyr⁻¹ in the 1960s to 2.4 ± 0.5 GtC yr⁻¹ during 2008-2017, with inter-annual variations of the ... Q3
My memories from school include that 0.04% of the atmosphere is CO₂. Q4 There was, at the time, an implicit understanding that this was where CO₂ was: it is there, so this is where it is and at no time did we discuss (in the 1960s) that the gas might also be elsewhere. We learned about the water cycle, not the carbon cycle. It was research in the late 1950s (which wouldn't have percolated far by 1965) that showed that atmospheric CO₂ varied a good deal, but knowing about dissolved gases in the ocean—and what any changes might mean—was a long way away and it was about 1980 before there was any understanding of the significance of global gas balance as affected by the oceans. So I'm a bit surprised to learn that there is about 50 times the atmospheric total CO₂ held in the ocean. Q5. A similar amount, proportionally, is held on land. Q6.
The following lengthy quote is from here, [12]. It is written at about the same density as I like, so I've not paraphrased.
Of the three places where carbon is stored—atmosphere, oceans, and land biosphere—approximately 93 percent of the CO₂ is found in the oceans. The atmosphere, at about 750 petagrams of carbon (a petagram [Pg] is 10¹⁵ grams), has the smallest amount of carbon. Today, CO₂ concentrations in the atmosphere are increasing as a direct result of human activities such as deforestation and the burning of fossil fuels (e.g., coal and oil). Over the past 150 years, CO₂ concentrations in the atmosphere have increased by as much as 30 percent (from 280 to 370 ppm). Q7.
All trees, nearly all plants from cold climates, and most agricultural crops respond to increasing atmospheric CO2 levels by increasing the amount of CO2 they take up for photosynthesis. It is believed that the increased uptake in land plants from rising atmospheric CO2 levels roughly counterbalanced the CO2 released from cutting down tropical rain forests and other agricultural practices in the decade of the 1980s. In the 1990s, the land biosphere was estimated to take up approximately 1 Pg more CO2 than it released each year.
Most of the CO₂ released from the burning of fossil fuels and other human activities (e.g., cement manufacturing) is stored either in the atmosphere or in the oceans. The CO₂ that remains in the atmosphere acts as a greenhouse gas, absorbing long-wavelength radiation (heat) in the atmosphere. CO₂ taken up by the oceans does not affect the Earth's heat balance, so an understanding of the air-sea exchange of CO₂ is an essential part of understanding the Earth's climate system and the potential impact of future CO₂ emissions.
The CO₂ that is recycled at depth is slowly carried large distances by currents to areas where the waters return to the surface (upwelling regions). When the waters regain contact with the atmosphere, the CO₂ originally taken up by the phytoplankton is returned to the atmosphere. This exchange process helps to control atmospheric CO₂ concentrations over decadal and longer time scales. In the 1980s, the oceans removed an estimated 2.0±0.6 Pg of anthropogenic CO₂ each year. Because humans are producing CO₂ at an ever-increasing rate, the average ocean removal rate increased to 2.4±0.5 Pg of carbon each year in the 1990s. The uptake of anthropogenic CO₂ by the oceans is driven by the difference in gas pressure in the atmosphere and in the oceans and by the air–sea transfer velocity. Because the pCO2 is increasing in the atmosphere, CO₂ moves into the ocean in an attempt to balance the oceanic and atmospheric gas pressures.
The relative concentrations of CO₂ (1%), bicarbonate ion (91%) and carbonate ion (8%) control the acidity (pH) of the oceans. Since CO₂ is an acid gas, the uptake of anthropogenic CO₂ uses up carbonate ions and lowers the oceanic pH. The carbonate ion concentration of surface sea water will decrease by an estimated 30 percent with a doubling of atmospheric CO₂ from preindustrial levels (280 to 560 ppm). As the carbonate ion concentration decreases, the buffer capacity of the ocean and its ability to take up CO₂ from the atmosphere is reduced.
Over the long term (millennial timescales), the ocean has the potential to take up approximately 85 percent of the anthropogenic CO₂ that is released to the atmosphere. As long as atmospheric CO₂ concentrations continue to rise, the oceans will continue to take up CO₂. However, this reaction is reversible. If atmospheric CO₂ were to decrease in the future, the oceans will start releasing the accumulated anthropogenic CO₂ back out into the atmosphere.
The ultimate storage place for anthropogenic CO₂ must be reactions that bind the CO₂ in a manner that is not easily reversed. Dissolution of calcium carbonate in the oceans, for example, is a long-term storage place for CO2. As the oceans continue to take up anthropogenic CO₂ it will penetrate deeper into the water column, lowering the pH and making the waters more corrosive to calcium carbonate. The problem is that carbonate dissolution typically occurs in the deep ocean, well removed from the anthropogenic CO₂ taken up in the surface waters. In portions of the North Atlantic and North Pacific Oceans, however, anthropogenic CO₂ may have already penetrated deep enough to influence the dissolution of calcium carbonate in the water column.
Burial of plant and animal material into the sediments can also provide long-term storage of anthropogenic CO₂ Interestingly, almost no phytoplankton seem to grow faster in higher CO₂ environments, unlike many land plants. This is because phytoplankton growth in the oceans is generally limited by the availability of light and chemicals other than CO₂, principally nitrogen and phosphorus but also smaller amounts of iron, zinc, and other micronutrients.
One proposed approach for enhancing carbon removal from the atmosphere is to enhance phytoplankton growth by fertilising specific regions of the ocean with a relatively inexpensive biologically limiting chemical like iron. The hypothesis is that the resulting bloom of oceanic plants would remove CO₂ from the atmosphere then transport that carbon into the deep ocean or sediments, effectively removing it from the short-term budget. The effectiveness of the "iron hypothesis" is being tested with several research efforts attempting to scale up iron fertilisation experiments.
Other carbon sequestration approaches, including direct injection of liquefied CO₂ into the deep ocean, are also being examined. Further research is necessary to determine whether any of these techniques will be effective or economically feasible. Implementation of these approaches may depend, in large part, on policy decisions made at national and international levels.
Notice the significance that phytoplankton does not thrive in higher CO₂ environments; thus the food chain is damaged directly as the seas become more acidic. Does this have consequences for coral reefs, or is the observed temperature increase sufficient to kill them off? This is not repeated on land, where the added CO₂ promotes plant growth.
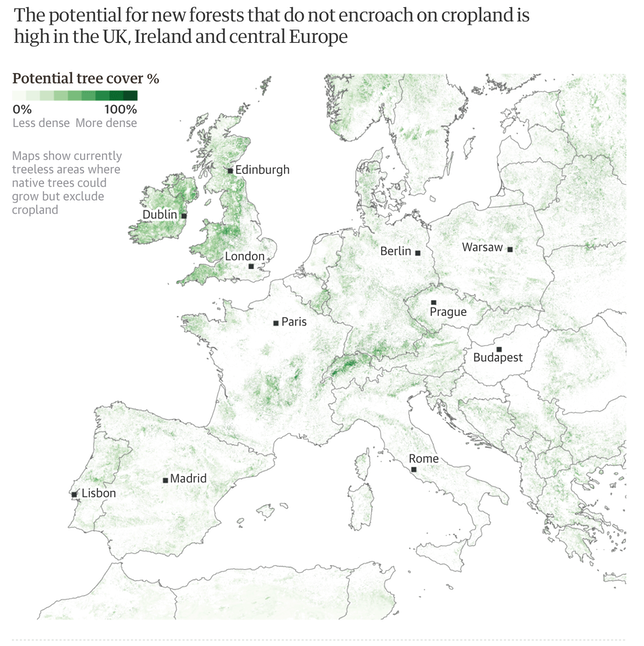
I suspect that the fastest way to remove atmospheric CO₂ is to plant trees. So obvious consequential questions would explore what area is available (not already used for arable farming and human habitation), whether we could plant trees and live and farm, how long it takes a tree to capture amounts we would notice (decades, I guess) and how the cost of this compares with the other ideas being explored. Funnily enough, the week after I wrote that last in draft, there is a published report covered in the press (20190705) saying much the same, [13]
DJS 20190620
Questions
1: If the % added per year each year was constant, what would that % be? How would you describe the resulting curve? What is its derivative?
2. If you take 1.2±0.5 GtC yr ⁻¹ in the 1960s to 3.2±0.7 GtC yr ⁻¹ during 2008–2017 as applying to 50 years and model exactly as you did for Q1, what is the annual % increase per year? What do you think this tells you?
3. Can you calculate how much energy is required to turn CaCO₃ into CaO and CO₂?
4. Is 0.04% CO₂ in the planetary atmosphere consistent with a figure of 413 ppm? Water vapour accounts for roughly 0.25% of the atmosphere by mass. The concentration of water vapour (a greenhouse gas) varies significantly from around 10 ppm by volume in the coldest portions of the atmosphere to as much as 5% by volume in hot, humid air masses, and concentrations of other atmospheric gases are typically quoted in terms of dry air (without water vapour) [wikipedia] Express 10ppm as % by volume
5. Discover the mechanism by which CO₂ moves between air and sea.
6. The oceans contain about 50 times more CO₂ than the atmosphere and 19 times more than the land biosphere. [here] Given that 71% of the earth's surface is water-covered, comment on the proportions of stored CO₂ in land and sea.
7. What is a petagram in tonnes? How does it relate to the Gt implicit in the unit GtC yr ⁻¹ ?
1 This produces 42.84% of natural carbon dioxide emissions. The oceans contain dissolved carbon dioxide, which is released into the air at the sea surface. Annually this process creates about 330 billion tonnes of carbon dioxide emissions. Implying that natural CO₂ amounts to 770 billion tonnes per year.
2 Land use changes are a substantial source of carbon dioxide emissions globally, accounting for 9% of human carbon dioxide emissions and contributed 3.3 billion tonnes of carbon dioxide emissions in 2011. If these figures come from the same set of data, then human production in 2011 was around 37 billion tonnes, around 5% of the 'natural' figure above.
3 There are significant fudges in the creation of the figures released in [5]. For example, we use the close relationship between the growth in GDP and the growth in emissions (Raupach et al., 2007) to project emissions for the current year. However, these fudges only apply to how it is we are changing the atmosphere, not the measurement of that change itself. Yes, one must be aware that CO₂ concentrations vary around the world at sea level and that there are gross assumptions being made, but the bulk of the gaseous CO₂ is high up and that is, by comparison with sea-level, far less variable.
This map from [13]. I have long thought that we should convert our grouse moors (back) to forest, preferably not pine.
This list has a lot in common with the next essay; it may even be the same list.
[2] https://whatsyourimpact.org/greenhouse-gases/carbon-dioxide-emissions
[3] https://www.wri.org/blog/2018/12/new-global-co2-emissions-numbers-are-they-re-not-good
[4] https://www.globalcarbonproject.org/carbonbudget/
[5] https://www.earth-syst-sci-data.net/10/2141/2018/
[6] https://en.wikipedia.org/wiki/Cement
[7] https://www.cement.org/cement-concrete-applications/how-cement-is-made
[10] https://www.understanding-cement.com/clinker.html
[11] https://cement.mineralproducts.org/documents/FS_12_Novel_cements_low_energy_low_carbon_cements.pdf
[12] http://www.waterencyclopedia.com/Bi-Ca/Carbon-Dioxide-in-the-Ocean-and-Atmosphere.html
[14] possibly the source for [13]. I don't have the right to access it. https://science.sciencemag.org/content/365/6448/76 Abstract: The restoration of trees remains among the most effective strategies for climate change mitigation. We mapped the global potential tree coverage to show that 4.4 billion hectares of canopy cover could exist under the current climate. Excluding existing trees and agricultural and urban areas, we found that there is room for an extra 0.9 billion hectares of canopy cover, which could store 205 gigatonnes of carbon in areas that would naturally support woodlands and forests. This highlights global tree restoration as our most effective climate change solution to date. However, climate change will alter this potential tree coverage. We estimate that if we cannot deviate from the current trajectory, the global potential canopy cover may shrink by ~223 million hectares by 2050, with the vast majority of losses occurring in the tropics. Our results highlight the opportunity of climate change mitigation through global tree restoration but also the urgent need for action.
[15] https://www.crowtherlab.com/our-research/ might be useful to you as further reading. If you prefer video over reading, use this, global tree restoration. The map widget failed for me.
1. (1.46)^1/250 = 1.001515, so 0.15% per year. Exponential. The derivative is still exponential, exponent only one less.
(1+i)ⁿ -> n (1+i)ⁿ⁻¹.
2. (3.2/1.2)^1/50 => 1.98% Some will respond that apparently the sea is coping with the increase. My response is (i) to question the numbers and/or the understanding of them (ii) to wonder where the upper limit is and (iii) to wonder whether that makes the sea noticeably more acidic (true, see) — in which case we will be losing marine environments for reasons more than increasing temperature.
(i) The numbers are not the same as for Q1. The 1.2 GtC yr ⁻¹ is the component that is kept in the earth sink. Which means that these two numbers show that this component of the CO₂ is increasing at around 2% a year.
3 I have no idea how to calculate it, but I found here a figure of 178kJ/mol for the process.
4. Yes. See the wikipedia link, which tabulates Nitrogen as 780840 ppmv (parts per million by volume) which is consistent with 78% nitrogen. Dense water vapour is 30000ppm = 3% so 10ppm = 0.001% Water vapour is about 2.5% by mass across the full atmosphere.
5 [12] The short answer is 'molecular diffusion'. When the gas pressure of one fluid is higher, CO₂ will move between the fluids to the lower pressure. The CO₂ that moves into the ocean reacts to form carbonic acid and from there carbonates and bicarbonates, which has the effect of reducing the gas content and so encourages more movement into the ocean. Two factors affect this further: CO₂ dissolves faster in cold water (by a factor of two between polar and tropical waters), and cooled water sinks. So the Gulf Stream, for example, serves well to take CO₂ out of the air even as it cools, then in some sense deposits the dissolved gas somewhere deep. The second process is biological, where marine life absorbs the CO₂ (and other material) in growth. Whether that removes CO₂ in the long term is not quite clear yet. My understanding is that it should, but the research doesn't yet support that belief. Where the ocean warms up and where small marine life yields up its carbon, the water returns CO₂ to the atmosphere. The research figures show marked variability in the transport of gas.
6 50/71 compares with 19/29; these are similar proportions, 70:66 or 1.075:1
7. A tonne is a thousand kilos, each of a thousand grammes (UK spelling, gramme), so a tonne is a mega-gramme, 10⁶ grammes. a petagram is 10¹⁵ grammes, so 10⁹ tonnes, a thousand million tonnes, one gigatonne. I expect some people will have misread petagramme as pentagramme, implying there being five sets of 000s. The UK spelling copies the French of our neighbours, not that of those the other side of the Atlantic; gramme and tonne. Forgive them, the US population doesn't use SI units willingly. But please don't copy them out of laziness.
Found after completion of the draft:
‘Landmark tipping point’ – 2019 will be the first year that fossil fuels make up less than half of the electricity generated, according to National Grid, following a dramatic decline in coal-fired power and rising renewable energy. A decade ago, coal plants generated almost a third of the UK’s electricity, but in the first half of this year they have provided only 3%. In the same time, renewable energy has climbed from 2% to 20% of all electricity produced in the UK. The National Grid is dubbing it a “landmark tipping point” and “historic achievement” in the road to a net-zero carbon economy by 2050. Guardian summary 20190621