
She who demands that she shall be obeyed asked what the middle class is. This explores the state of British class designations.
A fair working definition of the working class is based upon median income; the question then is where to draw the limits and the implicit assumption of the distribution being considered. Would you like the middle to be the middle half? the middle third? If you are prepared to define middle in terms of income, is it median ± half that value?
The Pew Center defines the middle group as from 67% to 200% of the median income. From [3]; The U.S. Census Bureau reported that the average median income was $59,036 per household in 2016. A household is any group of people who live together. Using the Pew Research percentages, that means households making less than $39,554 are low income. Households earning at least $118,072 are high income. This fits with the US ideas on higher tax bands. By this definition, 32% are low income and 22% below the federal poverty line of $25000 per year per household. It puts 42% in the middle and the remaining 26% over $100,000 per year. The USA Census Bureau considers high-income households to be the 12.3 percent who earn over $150,000. “High income” households make over $200,000.
CNN [4] also like the Pew Center definition, reaching the numbers of 47 and 141 ($000). They quote Prof Wolff at NYU, who defines middle class as the middle three-fifths of the wealth spectrum. Wealth includes consideration of savings and investments – I have no idea how one adjusts for income, perhaps by looking at what is disposable income.
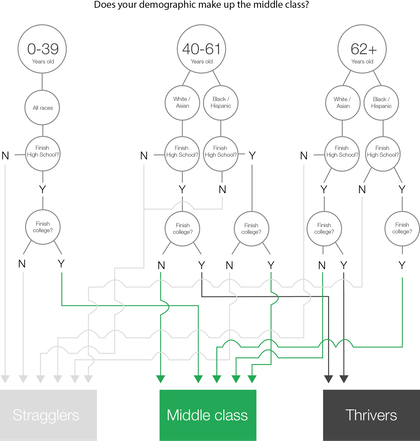
Another way to define middle is to look at consumption; Prof Sullivan at Notre Dame includes spending on food, transportation, entertainment, housing and other items. It excludes health care expenses and education, which Sullivan says might be considered investments. He defines the middle class as those in the middle fifth of spending. The associated diagram shows a middle third. Diagram above is from [4] from ‘the Fed’ who separate out Thrivers and Stragglers purely on ethnicity and education.
I very much like Eric Robbie’s explanation, found in [2] from the Guardian.
Paid by the week, rent your house – working class.
Paid by the month, own your own house – middle class. Don't have to work, inherited your house, plus estate – upper class.
Eric Robbie, Stroud, Glos.
Business dictionary defines the middle class as the middle third of the employed population, along with their families, making the (chief?) earner the defining characteristic. That leaves the extremes of age excluded.
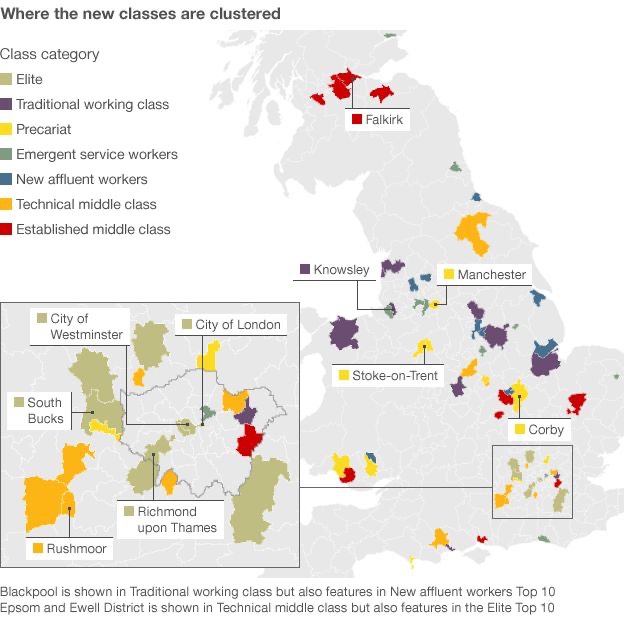
The BBC, in response to the issues in Britain over class, did an extended analysis and came up with something quite different. The link will take you to ‘the test’ which then locates you in this new spectrum. Depending on the size of my savings, we either belong in the technical middle class or (highly unlikely) the elite. The BBC categories are: Elite [6%] , Middle Established [25%] or Middle Technical [6%] , New Affluent [15%] , Trad Working [14%] , Emergent service workers [19%] and precariat [15%].
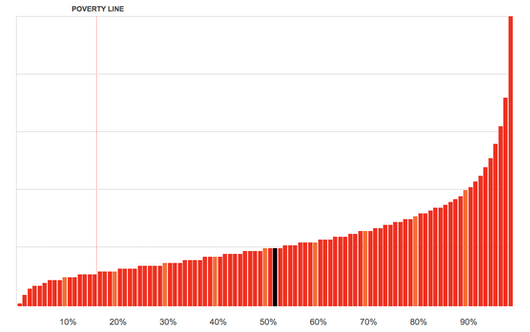
The mainly red bar chart shows distribution of income (gross domestic) in Britain. The black line resulted from me inputting the declared median value.
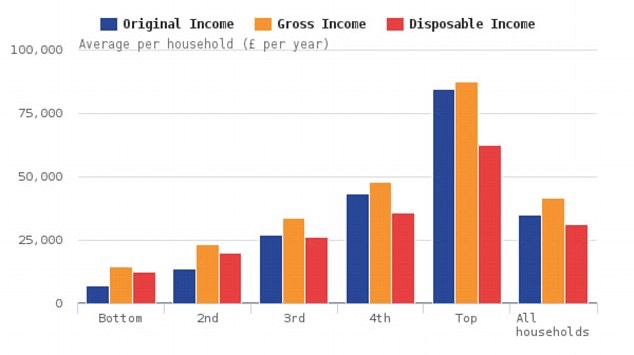
The bar chart in the colours of the Armenian flag (red blue and orange) is from the ONS via [7]. ONS figures for early 2017 were that the lowest fifth of households has original [median?] income of £7,153, the next has £13,877, the middle fifth has £26,983, the fourth £43,261 and the top fifth £84,747. The median original income for the whole of the UK was £35,204.
To see where you fit in terms of income, look here.
What is disposable income? ¹
What is wealth? Pretty obvious, really; it is what you hold less what you owe. Property value less the mortgage; all your financial holdings, less your debts; your pension pot (or the future value of defined income). Look at the ONS Wealth and Assets Survey.
I came across a suggestion that an interesting calculation would be lifetime wealth ratio (LWR) – add up all your income after tax (cumulative, really, all of it) and compare it with your net worth now. I think that this is flawed for age, and one reasoned argument supported that thought: This… is entirely age dependent assuming you earn any return on your investments. Basically LWR is smooshing together a few different metrics in away that is obfuscating instead of illuminating. A young person could be at 10% but actually on the pathway to an early and comfortable retirement while an old person could be at 70% and going to be soon eating dog food if they retire.
There are really two useful metrics:
Your savings rate tells you how well you are doing at saving relative to your consumption rate and this forecasts the total number of years you will need to work to support your living standard through retirement.
Your portfolio size combined with a safe withdrawal rate can give you a number of easy rules/metrics to give you a “retirement number” or other portfolio target that allows you to measure your progress towards retiring.
Those two things are useful starting points for savings and retirement planning and are relatively invarient [not my spelling] or else self-correcting to a number of idiosycratic [not my spelling] parameters for a given worker. This proposed LWR on the other hand has strong variance with the time in the labor force and a number of other parameters. The proposed table of percentages is in fact meaningless, since for a young worker they imply things are much worse than they are, and for an older worker give a false sense of security.
With which I entirely agree. But LWR is fairly easy to calculate in a ‘now’ sort of way, and it could quite easily be extended to wealth gains per year, if you were able to evaluate wealth at fixed points in time. It may be worth further exploration. Apart from the loss that can be referenced as divorce, mine has stayed pretty steady, capital matching total income, though I don’t see how that could happen. Is that what 'living within your means' is?
I may move thinking about wealth into a separate essay.
I am still struck that defining class by income leaves those not yet earning and those who have finished earning in some sort of limbo. This may be because, as [9] says: “Income” and “wealth” have incorrectly become synonymous in American culture. For many, ‘lifestyle’ is a label representing the rate of spend. It seems to me that these are, yet again, false metrics. If you are happy spending what you have now and if it doesn’t bother you at all that there is little in the way of savings against some unspecified disaster, then you are, by your own lights, happy – this is Good. I say that the valid measure might be happiness, but some people will only ever be happy with ‘more’, because their metric is relative apparent wealth (keeping up with the Jones’), not an honest assessment of whether this lifestyle makes them happy. Some of us are easily satisfied. For example, if you would be happiest living in Barbados and not needing to work ever again, great, but what have you done to make this dream become a reality? If, at some other extreme, you would be happy enough to be healthy, stable and able to cover your predicted costs, then that plan might take less work, but it doesn’t take no work at all. You might be happy to be able to show to yourself that whatever your LWR index was, it is no worse a year later… in much the same way that I fuss about age-grading in running results.
Much of the recent writing by me about migration and population refers to ‘development’, by which we seem to generally mean some abstract improvements in lifestyle or standard of living. While I accept that this may be mis-interpreted as equating ‘better standard of living’ with ‘more like me’ or ‘more like them’ (possibly some archetypical American), I may yet find some coherent descriptions expanding on this in terms of better health, improved life expectancy, improved net worth per household. At an individual level we do seem to be in need of some sensible ways of judging whether we are okay, slipping or improving. The same applies at regional and at national level, but too often we simply compare ourselves with our neighbours. This may not be a bad thing, but it is a relative rather than an absolute measure; I do not criticise that, only that we use such relative measures as if they are indeed absolute.
DJS 20171226
Ho ho ho.
Top picture to add
Disposable income is a surprisingly ill-used term. Dictionary definition is “after tax and social security charges”, which is indistinguishable from the ‘after-tax’ number on my decades of payslips. This makes sense, and is what I’d usually call net income. However, I have come across too many people using ‘disposable income' to mean something much nearer discretionary income, by which is meant the net income less obligatory payments, which I see class as paying for dependants (children and the very aged). I found several sites which define discretionary income as Gross income of an individual or firm from which direct taxes (such as PAYE, income tax) have been deducted. When essential expenditure (such as on food, clothing, shelter) is deducted from the disposable income, the balance is called discretionary income which the income earner is free to spend or save. [10] But then we have scope to fudge the figures remarkably by deciding what it is that is reasonable to spend on the food, clothing, shelter elements, which are, surely dependent upon your perception of acceptable lifestyle. So, recording what actually has been spent on these tells as much about lifestyle as it tells about income. Looking at our/my domestic expenditure I’d declare most of our clothes expenditure as entirely unnecessary, in the sense that we could easily do without, while our food expenditure looks trivial because we eat out so often. Which is to say, neither component provides useful information about the discretionary spending that has taken place. ‘Food clothing shelter', covers Mrs Imelda Marcos’ shoes quite well, don’t you think?
Even the ‘better’ versions of disposable income, such as this from wikipedia [yes I made another donation] have a significant fudge factor, rescued in this case by the ‘minimal survival expenses':
Discretionary income is disposable income (after-tax income), minus all payments that are necessary to meet current bills. It is total personal income after subtracting taxes and minimal survival expenses (such as food, medicine, rent or mortgage, utilities, insurance, transportation, property maintenance, child support, etc.) to maintain a certain standard of living.[7] It is the amount of an individual's income available for spending after the essentials have been taken care of:
Discretionary income = gross income – taxes – all compelled payments (bills)
Despite the definitions above, disposable income is often incorrectly used to denote discretionary income. For example, people commonly refer to disposable income as the amount of "play money" left to spend or save.
The trouble here is that the reference to standard of living is a predictive one – who is to decide what might apply? For many people the spending to meet a standard of living, even someone’s ‘minimum’, seems designed to make sure there is a minimal amount left at the end of any period. I suggest that this is a domestic money equivalent to Parkinson’s most famous principle, which I will paraphrase as such: domestic spending rises to meet the money available. Well of course it does. For some, saving is what is done after all the spending is over; for some the reverse is true. A few households—and I suggest that these are all nearer the minimum income for their household than the majority—actually recognise the difference between “minimum necessary spending” and “disposable income”; for these households saving is a hard-won battle, and furthermore that saving might be as specific as the next pair of shoes for the growing children, which for others would be unthinking, even almost careless, expenditure well within the interpretation of ‘necessary’. To make sense of discretionary income, we would need to have a recognised table of figures. Having gone that far, it is simpler to fall back on the proper term, disposable income.
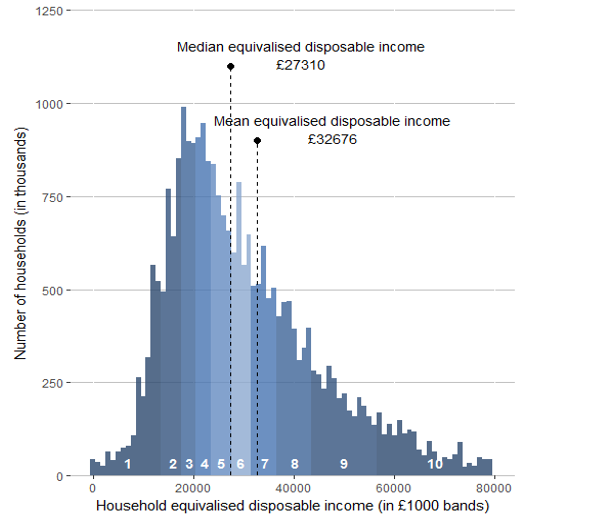
The UK ONS definition is this: Disposable income is the amount of money that households have available for spending and saving after direct taxes (such as Income Tax, National Insurance and Council Tax) have been accounted for. It includes earnings from employment, private pensions and investments as well as cash benefits provided by the state. [11]
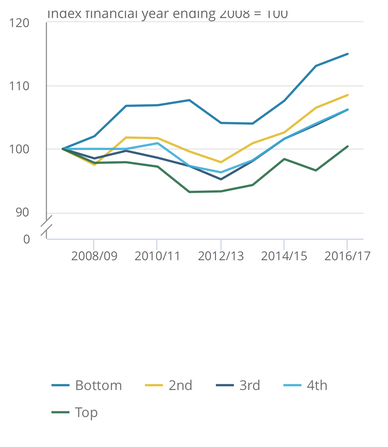
2017, UK figures: median disposable income £27,300 (a slight rise). Over a period like the last decade, the poorest fifth have had an improvement of £1600 while the top fifth have had little movement. This is perceived as an improvement in income inequality. The distribution shown would be well modelled by a binomial function. Fig 4 (below, source [12]) shows the movement over the last ten years, by quintile. The lines, whose colours I found hard to distinguish, end such that the quintiles finish in reverse order, bottom quintile at the top, top at the bottom.
DJS 20180110
[1] https://en.wikipedia.org/wiki/Middle_class
[2] https://www.theguardian.com/notesandqueries/query/0,5753,-1257,00.html
[3] https://www.thebalance.com/definition-of-middle-class-income-4126870
[4] http://money.cnn.com/infographic/economy/what-is-middle-class-anyway/index.html
[5] http://www.bbc.co.uk/news/magazine-22000973
[6] https://www.theguardian.com/society/datablog/interactive/2012/jun/22/how-wealthy-you-compared
[7] http://www.thisismoney.co.uk/money/news/article-4110482/How-rich-Work-income-wealth-sits-UK.html
[8] https://www.ons.gov.uk/peoplepopulationandcommunity/personalandhouseholdfinances/
incomeandwealth/bulletins/nowcastinghouseholdincomeintheuk/financialyearending2017
[9] https://www.moneycrashers.com/wealth-and-income-difference/
[10] http://www.businessdictionary.com/definition/disposable-income.html
[11] https://www.ons.gov.uk/peoplepopulationandcommunity/personalandhouseholdfinances/incomeandwealth/bulletins/householddisposableincomeandinequality/
[12] Search for ‘ONS household income movement by quintiles’ - or quite a bit less;) you want the current report titled
Household disposable income and inequality in the UK: financial year ending 20xx
This should get you to the current ONS report; page down to Fig 4. Here’s the one for 2017, current in October 2018.