
I am thoroughly tired of the apparently endless succession of question on Quora asking whether <time> for <distance> at <age> is ‘good’. Is a seven minute mile okay if I’m 18? Is an hour for 10km ‘good’? It depends on so many things whether ‘good’ applies, or what ‘good’ might mean. A 7 minute mile might well be pretty good if you’re over 60 or under 12, if your BMI is over 30 or if you’ve recently been through major surgery. An hour for a 10km is not quite so good, but again, ‘good’ is hugely subjective and needs to be in context.
However, one can remove the age element from the question. If you have not come across this, welcome to the concept of age-grading. I’m going to attempt to fix all those question I find so irritating, because they really all deserve the same answer: go look at age-grading. But they don’t or won’t bother to ask a better question so as to have a better answer.
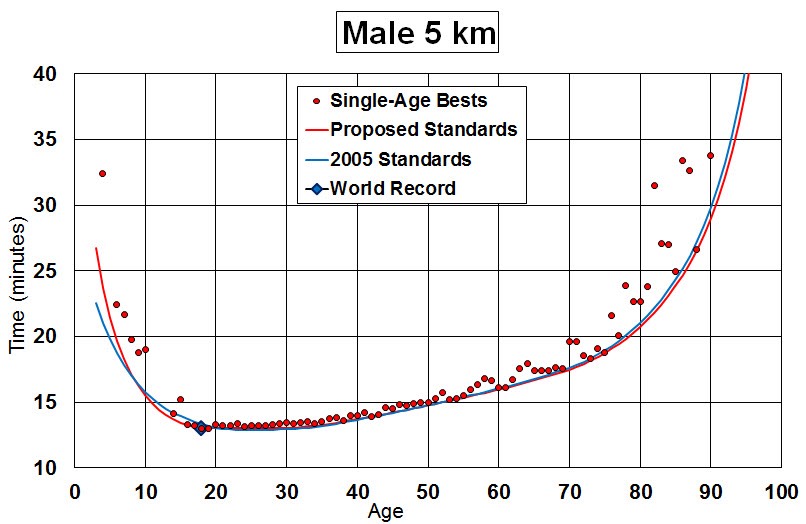
At heart, the tables are created by there being lots of data of results from athletics and running events at which age is also recorded. Indeed, once the Masters tables¹ began, so the addition of age to a record became standard. Having established what a world record is for an age, interpolating as appropriate² and applying some smoothing, your ‘age-grading’ is expressed as a percentage of the world record speed for your age. Since this is smoothed, it is still possible for an exceptional 100+% event to occur - and it has done. Enough of these causes the tables to be revised. For example, the single age records for ‘long’ distance (5, 10, 21.1 and 42.2 km) include 65/322, a nice round 20% of them, over the 100% mark, suggesting that the tables should be revised. As [3] says of the graph I copied form there and shoved above, There are very small differences between the 2005 Standards and the Proposed Standards. The very young youth standards have been softened because some earlier times for young runners have not survived scrutiny. On the other hand, upper teen year standards have been toughened because of fast times run by young Africans. This carries through for all distances… There is a drift away from the target curve above 70, but soem exceptional people show that the curve might well be right, so I see this as the running population over 70 being really rather small. The ladies have been doing similarly well - see [3] for yourself, please.
I’m going to address the male 5km figures, but hope to do this in a way that you can see how to work out what interests you - or simply bother to go to [2] and find the answer you want, perhaps by giving the calculator several items of work.
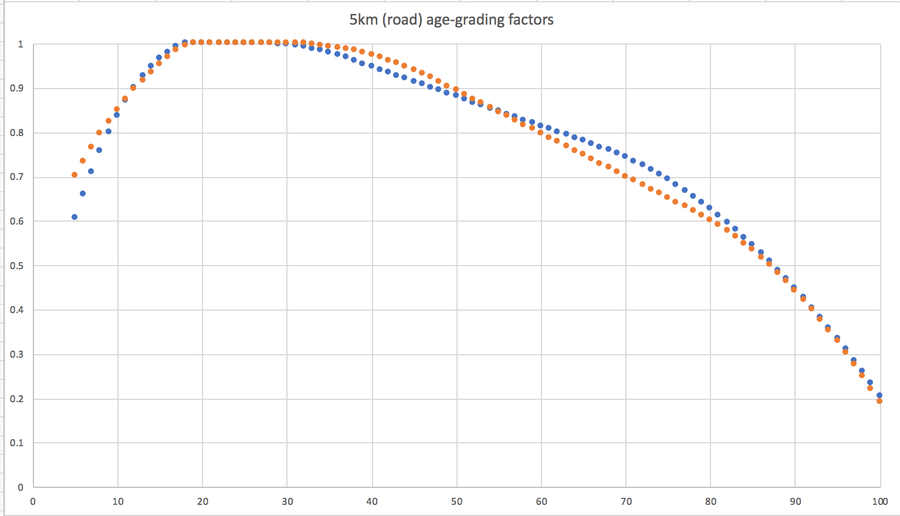
Here is a chart I made showing the age-grading factors for men (blue) and women (orange, not pink) for 5km not-track, so called road. Yes, it hits a ceiling around 18-30, when you times have no age-adjustment and then it decays in a regular, even surprisingly linear manner to late age. I see the men as decaying from 35 to 70 as remarkably straight (linear) at 0.672% decay per year while the women’s figures run ten years later, from 45 to 80 at 0.971% decay per year (I’ll accept some dispute over that last digit)³
The modelling (and I may produce some maths exercise to study this) is separated into Youth (before the age-factor is unity, gradient positive) and masters (past-it, gradient negative). The flat part is joined to the linear part by a parabola, followed by another parabola for the very much older runner. If I pursue this thread, it will be in the maths section with a link here.
So, what is a ‘good’ time? There are many ways to answer this, but I’ll pick two, the personal and the regional.
What is a good time for you? That depends entirely on you having some idea of any history of times and distances. If you are moving from no exercise to some exercise, well done and please feel encouraged to continue. Keeping track of times and distances (possible also weather health, route and other stuff you think relevant) will only serve to encourage - because generally it will improve. Age-grading is not relevant to you unless you were a runner / athlete many years ago and want to compare then and now, especially having had a lot of time off, like decades.
Is the time you’re doing good in a more absolute sense? The % of record pace that the age-grading tables produce is a good way of measuring, because it separates the distance/time information from the performance. If you’re doing several distances, teh tables allow you to discover if you’re actually genuinely better at some event than another. Imagine you’re at 60% on 100m but 65% at 800m and 70% at 5000m. Is that not a hint at what you’re good at? If you dramatically prefer the shorter distances, it tells you how to address training and sets you a standrad to aim for - clearly, to me, if 70% is happening at one event, that is the target for other events, since the body has shown itself capable of that performace level.
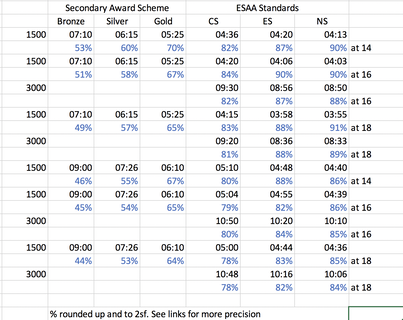
The ‘absolute’ nature of age-grading answers questions like “Is this good for a 10-yr old?”. [4] shows the ESAA standards (English Schools Athletics Association) and provides three times / distances, labelled CS, ES and NS, the standards at County, Entry and National, where County means a good performance at County level, Entry means the level for selection to represent the County, and National is that bit better still, with some attached award and perhaps drawing some external interest. The 5000m is not on this list, but the 1500m and 3000m are. I added in the Schools Secondary award scheme which seems to be a pretty general or even crude affair, so input the times for the three ages to be found in such schools. I put all the age-graded % in blue. So National Standard is very good, at 85-90%, County Standard is very good, at 78-84%, and the school standards are perhaps something to aim at, so that if you were to reach the gap between Silver and CS, you’re moving from ‘able to run’ to ‘a runner’. Or as my race had it yesterday, everyone over 70% was a ‘real runner’. Source: me, thought the times come from the listed sources.
What is important here is the same two-fold measurement: (i) you’re comparing yourself now to yourself at some other age and (ii) you see where you fit in comparison to the record. This is not where you fit in the population, though. I ran at around 78% in races and finished in the 96th percentile (the top 4%) pretty consistently. That tells you as much about who turns up to races as it does about what 78% means in terms of finishing position. These days, 78% is a very good day and, being ancient, equates to 62% 30 years earlier, more like the top fifth in a wide-distribution run like a parkrun, but well into the bottom half, below the 40th percentiile, in a club race. See, it is who turns up. At a parkrun, a 78% performance might put me in the top three on age-grading - again, it depends who turns up. But 78% now defines ‘a good day’. It also shows why I was never quite at County Standard on the track.
Thinking of school age performances, over 65% is competitive and at 75% you might win at school and lose against other schools—it all depends who turns up. At better than 75% you’re in demand to be in a school team. Age is not relevant here, because you’re looking at age-grading. Embarrassing though it is, to match my 78% at 5000m, you’d be aged just over 8½. No wonder than that I find myself racing the 10-14 year olds at parkrun. A newly 14 year-old finishing next to me (on the proverbial ‘good’ day) scores 64%. Is he a good runner? Quite possibly, since (i) he turned up and ran. If he keeps on running he won’t stay at 64% for long. At my great age I’m simply very glad to be able to run at all and that I’m at much the same (graded( standard as thirty years ago, absolutely brilliant. There’s a wonderful man at parkrun most weeks at the grand old age of 86. He runs at around the 65% mark, which is around 38:30 minutes for the 5km; but occasionally he has a really good day and hits the low 70s. Of course he is the course record holder; the running population at his age is very small indeed. That also means, as is shown every week in the young ‘uns, the over 60s, that those who turn up are very competitive. If I finish in the top three of the over 60s, I had a good day; but it is perfectly possible for me to run a PB for the year and finish fifth of the past-its. When you’re looking at position, it really does all depend on who turns up.
DJS 20181021
[1] http://bmaf.org.uk/age-graded-standards/
[2] http://www.howardgrubb.co.uk/athletics/wmalookup15.html download the spreadsheet of numbers with this Excel link or find it at [2]
[3] http://www.runscore.com/Alan/AgeGrade.html
[4] https://www.esaa.net/v2/2018/tf/tf18currentstands.php
¹ I want an apostrophe in there, Masters’ tables, tables belonging to the old folk what still run. They are not referenced with any apostrophe at all, so me adding one doesn’t help you. Hence I put the moan about that here, relatively out of the way.
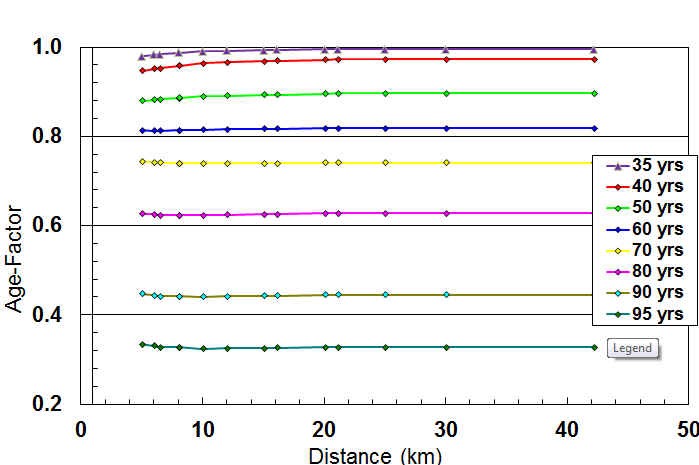
² [3]: To get the factors in the intermediate distances, the parameters were interpolated between the values obtained for those four distances. Let me make clear that the age-standards are not interpolated; it is the parameters that generate the standards which are interpolated. See [graph, right] for definitions of these parameters. To make sure there is a smooth transition as one moves to different distances, a plot of age factors was made against distance as shown below.
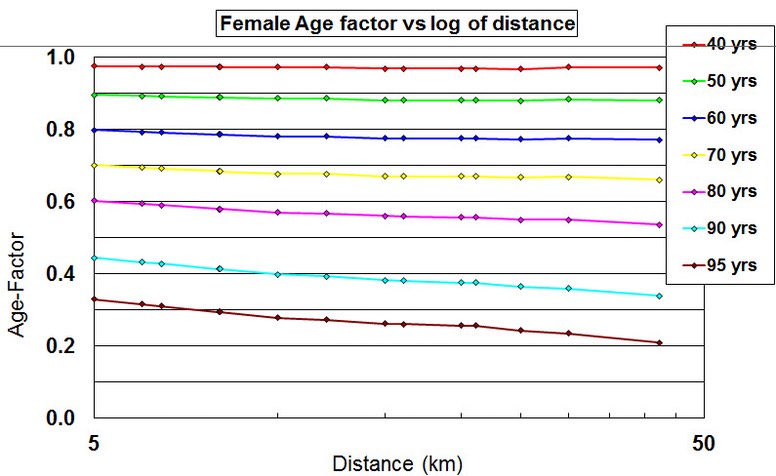
Notice, please, how constant these factors are across distances. I think it is remarkable how little decay there is from 35 to 60. The curvature seen at the shorter distances for 35-60 says that older runners are closer to the open class times than the younger runners. [3] provided a different equivalent graph for the women, which I’ve left a little smaller, which {3] comments as indicating that the female runners are closer to the open class times at the shorter distances whereas the male runners are better at the longer distance.
³ I ran regression, using LINEST in Excel, on the data for the chart to get these figures. There was very little change in the gradient of the line of best fit depending where I began the series; e.g. the women’s figure moved form 0.971 to 0.972 if I moved the start to 50, and the men were at 0.672 with starts from 46-49, with the last digit one smaller as the range to 70 grows. So the decay number given is pretty reliable.