Having found where to look for information about Beijing’s pollution, I found some better sources.
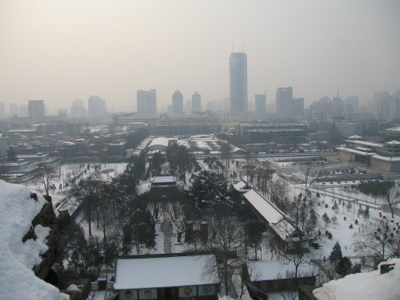
Yesterday, Sunday 10th Feb was a blue sky day and the moment I realised this (embarrassingly late to notice the sky; an email told me to look!) I went running to enjoy it. Still damn cold and my hands were numb on return (‘cos the same stupid twit still hasn’t found the right weight gloves packed away somewhere).
Today I bothered to look earlier and we’re back to the white sky blur. I ask bjair.com what the reading is and it says just over the 100, so USG (unsafe for sensitive groups). I rediscover that iPhone and iPad won’t pick this up because I’m skin-flinting on accessibility (I don’t like paying ‘per anum’, as was once printed at my first school).
I was looking to see what records (history, not distant local stationary values) are and available found two sites, one with the Beijing air history and another with processing of that data, “Live from Beijing”, which isn’t. Live, that is.
I assume you have read Air Quality Issues, essay currently numbered 104. Therefore you are now familiar with the terminology and the fight to ascertain what units might be in use. A Blue Sky day is a term used in the Nanjing Hash to describe the start/finish point of choice, a certain eponymous hostelry part-owned by one of the club members. It is also any day where the AQI falls below 100, moderate but ‘safe’, meaning you won’t fall over today from the damage caused by the immediate pollution levels. The China target is an AQI of 75 (in the draft legislation; a good, ambitious but achievable number). Incidentally, this is the PM2.5 figure, not PM10; those figures aren’t released in a way that I can find as yet. I observe that today is such a blue sky day and that the sky is white. The count of such days can be easily fiddled with – is a blue sky day one where the count stays below 100 all day? (it should be) or one in which at some part of the day the count went under 100?, or one where the average for the day (and we could choose which average¹ to suit the preferred result) is under the target?
As you will have realised from the previous writing, any games played with the numbers must start from the µg/m³ concentrations, since the AQI scale is (virtually) a step function.
Please click on the city/link to see the state of the air in Beijing and Shanghai right now
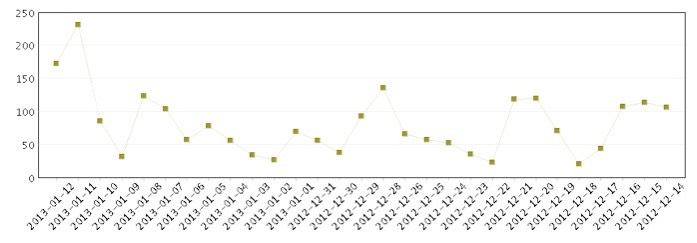
..and here is a graphic from the national data centre. It often disagrees with the previous source.
Exercise: using the information learned in the previous essay, attempt to identify the units of the y-axis. The 12th January was the much-publicised event of really bad pollution levels.
Vance Wagner of livefrombeijing has produced a graphic showing air quality, which I copy here enlarged (and I see the diagram suffers for that enlargement; my apologies).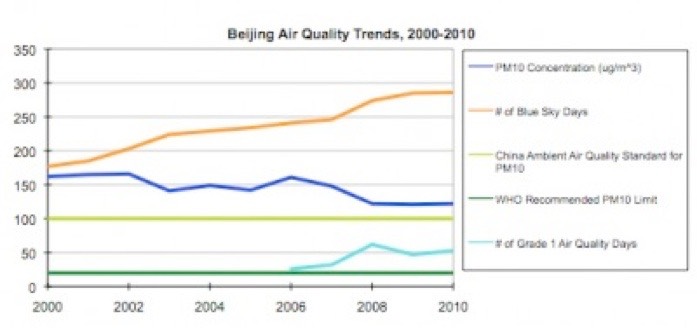
It looks good, reporting a steady improvement. Loads of questions follow from extracting information without the base data, Of course. Is this genuine reporting? What is the y-axis unit? See the improvement jump over the 2008 Olympics? How would you hope to present these figures? If we are to believe the graph, then Beijing was near to the WHO standard for PM10 particle pollution in 2008. Bring on the PM2.5 figures, then.
The (really helpful) website has an entry for January 2013, here. It includes an essay from the New York Times, visible on their chinese website, also worth reading. Assuming that the reporters do a better job than I do in finding reliable sources for their comments, I quote from the article, not in the original order:
Air pollution is regional
Because pollutants travel easily in the atmosphere (and some pollution sources, like vehicles, travel themselves), air pollution is fundamentally a regional problem, requiring regional or – even better – national solutions. Scientists have estimated that between one-third to two-thirds of Beijing’s pollution is caused by emissions in the surrounding provinces. Beijing’s government has implemented dramatic and impressive measures over the past decade to reduce pollution emissions within its boundaries; for example, the city has nearly eliminated coal-burning, implemented the most stringent vehicle emissions and fuel quality standards in the country, scrapped hundreds of thousands of high-emitting cars and trucks, and forced major industrial plants to relocate. However, pollution level spikes in the city continue to occur throughout the year, and average air pollution levels are far from meeting even China’s air quality standards. Though cities undoubtedly have a critical role to play in reducing emissions in China, air pollution cannot be solved exclusively at the municipal level.
Geography can further complicate the pollution story. Cities bounded on two or more sides by mountains – such as Beijing and Los Angeles – are even more susceptible to severe pollution episodes. In Beijing’s case, winds blowing gently from the south carry air pollution from across central and northern China and trap it against the mountains to the north and west of the city.
The enormous, current economic costs from the health burdens of air pollution in China have been estimated to total at least 1.2 percent of GDP. [source, please].
Vance Wagner also wrote and linked to the ICCT - the International Council for Clean Transportation - staff blog. Hopefully, if you click on links, a new window opens; I don’t often remember to set that helpfully and apologies for that. In this, he says that the principal source in densely packed volumes is vehicle emissions. This is made worse by a lack of controls and by the rapid growth of the market [Have I not written about that? I did the research last year]. Not least, the standards and construction of the heavy trucks exceed all the desired standards (on the wrong side), as does, he points out, fuel standards. That goes some way to explaining the pH 3.5 in the snow at school referred to in the previous page.
I thought the principal source was industry, particularly coal-fired power stations, not vehicles. I’ll ask and research more. One of the unlikely identified contributors is shipping, see Halfeng Wang’s blog post at ICCT. Before you jump to the conclusion that this is qualitative assessment not quantitative, he answered that; a typical ship equates to 7300 cars and he gives the detail quite well². I quote here and in footnotes:
When scientists in Shanghai tried to identify the sources that contributed to its chronically poor air quality—the first such attempt in mainland China—they found that, counting only activity occurring within the jurisdiction of the port, shipping accounted for more than 5.5% of PM and 12% of SOX concentrations in the city.
Mr Wang goes on to point out that few countries have successfully attacked shipping as a source of pollution. Even where they are targeted, it appears that ships use pretty dirty fuel at the best of times. [More on this, maybe, in the future]
DJS 20130211
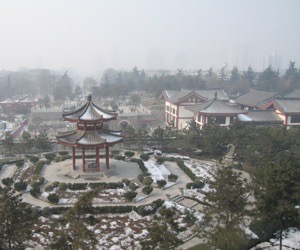
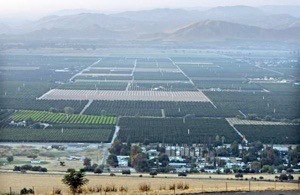
Picture to right and at top are mine, Xi’an 20080126 and 20080203, very close to five years ago, on fairly typical days. We saw the local mountains from school once only that year, being the first time most of the kids had every seen them. Apparently there were similar experiences with the San Joachin mountains outside LA. Corresponding (lower) US picture from peakwater.org/
1 Come on, you know this! Again: mean (add ‘em up and divide by how many); median (middle one when they’re ordered); mode (most common). For a distribution with a single mode, the mean will be on the opposite side of the skew, over on the longer tail; the median will be between the mode and the mean. Mode is a fairly useless gauge unless the data was grouped, say by the bands of colour on the graph. Go revise Statistics: the simple stuff
2 On average, the engines of a medium- to large-size container ship (6,000 “twenty-foot equivalent unit”, or TEU) produce about 60 megawatts of power, equivalent to a small electrical power generation plant. The particulate matter churned out in one day from just one vessel that size running at 70% maximum output and using 35,000-ppm sulphur marine fuel equals the emissions from 7300 passenger vehicles in China for an entire year.* And a new vessel arrives in or leaves the port of Shanghai about every 4 minutes—about 13,500 arrivals and departures per year.
*PM emission factor from shipping (g/kW-hr) is calculated from EPA (2009) “Current methodologies in preparing mobile source port-related emission inventories”; PM emission factor in Shanghai was assumed to be 0.015 g/km; annual km of a typical passenger vehicle is about 15,000 km.
.... if the above-mentioned 6,000 TEU ship uses marine diesel oil with 10,000 ppm sulphur just for one day, the PM2.5 reduction would be equivalent to taking 3,400 passenger vehicles off the road for an entire year.
20130212, trying to write some maths I find that the Chinese have an english version of their website, I found this, and quote from it in colour:
...Light-duty vehicles have been growing fast in China as more Chinese families can afford a car. [Car-planting licences are available from your local govt office; make your car grow!] About 16 million light-duty vehicles were produced and sold in China in 2011, ranking No.1 in the world for three consecutive years, and the stock of such vehicles amounted to 82.64 million. However, while vehicles bring us convenience, they also cause severe environmental problems. Study shows that 800,700 t NOx, 65,000 t PM, 1.622 million t HC, and 16.217 million t CO were emitted by light-duty vehicles across the country in 2011. Light-duty vehicles have become the primary source of air pollutants in metropolises such as Beijing. However, the vehicle stock is still growing fast in coming years, and latest statistics indicates over 19 million automobiles (including about 17 million light-duty vehicles) were produced and sold in 2012. The stock of light-duty vehicles is expected to have grown by around 80 million during the ongoing Five-Year Plan period from 2011 to 2015.
Ambient air quality standards (GB 3095-2012) specifies PM2.5 and O3 (Max. 8-hour average) as pollution indexes, sets lower emission limits for other indexes including PM10, and calls for strengthening the effort to fight air pollution by major industries.
The second draft .... sets lower emission limits for original pollution indexes (NOx-25%-28% lower, PM10 -82% lower) and significantly cut down the emission contribution of every single new vehicle. PN [PM?] is identified as a new pollutant index, which may advance the adoption of more effective emission control technologies and reduce particular matters specifically PM2.5. The mileage required for evaluating whether a vehicle meets emission standards has a twofold rise from 80,000 kilometers before to 160,000 kilometers. There are stricter emission requirements for OBD [Onboard Diagnostics], which is much better for monitoring the actual emission conditions of vehicles. [This] necessitate[s] car fuels of the same standards, the date of enforcement will not be identified until a clear timetable is set for supply of such fuels in the market. [T]he emission control requirements .. are equivalent to those of [the EU].
http://aqicn.org/city/london/ goes in here
and for comparison, here is London’s current AQI from aqicn.org I hope it works for you!