
The politicians talk about 'levelling up', meaning to change the balance between the disadvantaged, mostly in the North, and the clearly advantaged in the South, especially those within 60 miles of London. When I searched widely enough, I found that many parties have had something to say. Of those, most jump to conclusions that I would call political, but a few stop at the point of describing the scope of the problem. What I propose to do here is attempt to sift through that information and only then attempt to classify the responses and recommendations. Each report I have read that insists that there are actions moves itself to later consideration.
Therefore I begin with the O'Brien report, partly because it was what I found first, but also because it sets the scene well. [1]. Neil O'Brien MP provides some measures to the situation, to what it is that that we should 'level'.
Seats gained by the Conservatives in 2019 don’t just have lower earnings than the seats the party already held, but earnings on average 5% lower than seats currently held by Labour. Of the bottom quarter of seats in Great Britain with the lowest earnings, more are now held by the Conservatives (77) than Labour (74).
Compared to the seats the Conservatives gained in 2019, homes in seats held by Labour were on average £62,000 (a third) more expensive.
Since the mid-1990s London has pulled ahead of the rest of the country. Having been the same size as the economy of the north of England as recently as 2004, London’s economy is now a quarter bigger. London’s gross value added (GVA) before the coronavirus crisis was the size of the North plus Edinburgh, Swansea, Belfast, Bristol and Birmingham: it is as though it has added all those national and regional capital cities to itself since the middle of the last decade.
In London income before tax and benefits grew two-thirds faster than the rest of the UK, and income before tax and benefits is now nearly 70% higher in London than the rest of the UK, up from around 30% higher in 1997.
On a wide range of measures the UK is one of the most geographically unbalanced developed economies. In Germany 12% of people live in areas where the average income is 10% below the national average, while in the UK 35% do.
Opportunity is not evenly spread: In Greater London over 45% of poorer pupils who were eligible for free school meals progressed to higher education in 2018/19. Outside London there were 80 local authorities where richer pupils not on free school meals were less likely than this to go to university.
Large cities in the UK grew both their total GDP and their productivity per worker faster than their surrounding areas since 1997. However, on average cities saw slower growth in income per resident than their surrounding areas. That may reflect a different and changing composition to the population in the cities compared to the surroundings (e.g., more students, more migrants, different age groups), and/or reflect faster growth in commuting and commuter incomes.
In rural areas defined by the ONS as “sparse”, people’s income levels are 17-18% lower, and are lower even after controlling for people’s age and qualifications.
The O'Brien report says: Government should set itself three key tests of levelling up:
- Are the bottom fifth and bottom half of local authorities by earnings growing their earnings more quickly than they have in recent years?
- Are the bottom fifth and bottom half of local authorities with the worst unemployment seeing unemployment rates falling and converging with the national average?
- Are the bottom fifth and bottom half of local authorities with the lowest employment seeing employment rates rising and converging with the national average?
Right now, I think the London-centric view says "We're alright" ¹ and therefore "What's the fuss?" I'm afraid what I read above merely strengthens my wish to have London secede from the UK. Say within the limits of the M25, with border controls so that either workers move to live inside or the work rapidly moves outside. I don't much care, but it is very clearly Somewhere Else and not (in) the same country I have lived in most of my life.
This report [1] does demonstrate the inequality that we refer to as the North-South divide but is much more nearly proximity to money and its drift towards the capital. Even close to the money, there is dramatic deprivation. However, the big picture says we strongly need to counter the drift to the capital and somehow do this permanently. I don't think anything that develops other centres will fix this properly, but I do think that is what will happen. And, as ever, the 'progress' process will stall when it reaches Birmingham going northwards. As with HS2, the right way to develop this is to start in the North.
I am struck by the phrase the UK is one of the most geographically unbalanced developed economies and I think that maybe this nicely summarises the need for levelling up. I found almost the same words in source [2], from which (whence) I have copied some of the key findings:
1. The UK is one of the most geographically unequal countries in the developed world; compared with 26 other developed countries, it ranks near the top of the league table.
2. The UK’s regional inequalities are deep-rooted and complex: even well-designed policies could take years or even decades to have meaningful effects.
3. There is no single set of factors that characterise a ‘left-behind’ place, and the government cannot be all things to all places. We combine measures of pay, employment, formal education and incapacity benefits to identify which areas might be considered ‘left behind’ and in need of ‘levelling up’. These areas can be found across the country, but left-behind places are particularly concentrated in large towns and cities outside of London and the South East, in former industrial regions, and in coastal and isolated rural areas.
4. We find that the traditionally ‘left-behind’ areas are not those most exposed to the short-term economic impact of COVID-19. This complicates the picture with regard to ‘levelling up’, since it introduces another dimension of geographic inequality. There are, however, important exceptions: a number of hospitality- and tourism-dependent coastal communities and the centres of some Northern and Scottish cities (such as Liverpool, Glasgow and Dundee), face the ‘double whammy’ of being both ‘left behind’ and vulnerable to the immediate economic fallout from the pandemic.
5. Brexit could make ‘levelling up’ more difficult. While the economic impact of Brexit remains highly uncertain, the options on the table are likely to impose a particularly high economic cost on some groups, such as less-educated male workers in blue-collar jobs. Many of these are concentrated in traditionally ‘left-behind’ areas in the North of England, South Wales and the West Midlands.
6. Currently, some sorts of public spending – transport and R&D, for example – are heavily concentrated in London and the South East. Increasing spending on these in other parts of the country might help with levelling up. But we should not forget that ‘current’ spending – especially on things such as schools and further education – may be as, if not more, effective.
7. There are at least eight existing place-based spending programmes relevant to the ‘levelling-up’ agenda. These include the EU’s Regional Development Fund, which provides funding only until the end of this year. Rather than reinventing the wheel, the government could seek to build on these schemes, and develop a broader strategy around how they fit together. The Chancellor should also pay particular attention to the important role that local governments will play in ‘levelling up’.
8. R&D, for example – are heavily concentrated in London and the South East. Increasing spending on these in other parts of the country might help with levelling up. But we should not forget that ‘current’ spending – especially on things such as schools and further education – may be as, if not more, effective.
9. There are at least eight existing place-based spending programmes relevant to the ‘levelling-up’ agenda. These include the EU’s Regional Development Fund, which provides funding only until the end of this year. Rather than reinventing the wheel, the government could seek to build on these schemes, and develop a broader strategy around how they fit together.
10. This year’s Spending Review is a natural opportunity to set out details on these and many other areas. The Chancellor should pay particular attention to the important role that local governments will play in ‘levelling up’ – potentially as a part of a broader devolution strategy – and ensure that this is backed up with adequate funding, both for investment and for running costs.
Regional inequality [2]
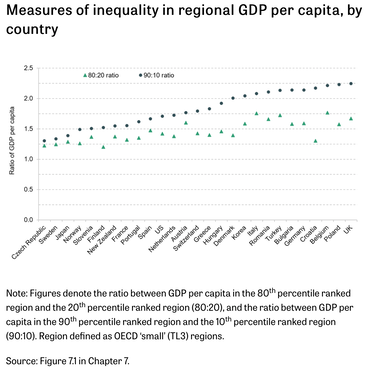
The measure is to look at the relative disparity for identified sub regions within a nation. Once ranked, to compare the 90:10 points and the 80:20 points For Britain, the 90th percentile ranked region is Aberdeen City and Aberdeenshire and the 10th percentile ranked region is Durham. GDP per capita in Aberdeen is 2.25 times higher than Durham. This is the highest ratio (biggest difference) of all countries in the sample. On this measure, then, the UK is the most regionally unequal country that we look at. The 80:20 points are York (80) and Breckland and South Norfolk (20). GDP per capita in York is 1.67 times higher than in Norfolk. Only in Belgium, Italy and Turkey is the 80:20 ratio higher.
I'm quite tempted to just stop already. Repeating some of the above back to you, this is not something requiring a quick fix, but rather the reverse, a deliberate change in strategy so that levelling up can occur at all. Do (please) read the detail of the 'chapter' for yourself; you should consider that as expected background reading. Things need to move from the south east to elsewhere which requires infrastructure, but only as part of a wholesale package committed to change. In my head I'd point straight at HS2 and say straightaway 'started in the wrong place', never-mind the 'Just why are we doing this?'. So the how rapidly becomes the where and that is also not at all obvious (points 3 and 4). Some places fit both left-behind and caught-by-Covid (Blackpool is one such, rather to my surprise) and politically I'd expect the 'red wall' to be a target for largesse. I recognise that, short of moving the capital, certain sorts of power will always gravitate towards London; we might well decide to accept a level of regional inequality in GDP per person (a suitable measure, I feel), but perhaps we should set limits that are reflected in things like planning approvals and incentives to be elsewhere. For example, is it okay for London earnings to be 30% above the national (mean) average? Would 30% above the median be acceptable? 20%? What are we prepared to do to cause change to occur? But, [2] says (and so does the wife) should we be looking at a regions as if separate when there is, for example, dire disadvantage within the capital? Does that not suggest that there is inequality, disparity and disadvantage within any region, London included? The inset text box gives one measure for inequality of several; across all of these, the UK comes out top, meaning the most extreme. [2, page 322-4].
How do we identify a place which is left-behind and in need of levelling-up? Is geography a suitable criterion? Does using that already limit how change can be engineered? This is a complex problem and those are rarely solved by a simple change, but it may be that the strategy behind the wanted changes is actually quite simple. Broadly, the expected measure is some sort of economic underperformance (which is why I was happy with GDP per person), but when that occurs there are already underlying factors such as a low skills base, poor general health, relative poverty, relative unemployment and deep-rooted issues, not all socio-economic. My own reaction to this is "What could we fix that ties in with other things we want to do?", because that way we'd get something started and begin to move things in a better general direction. But even to do that much we need there to be a national-level want to make this occur; we have to agree what we mean by 'better direction'. What bothers me about that is that most of us see that when one place gains, another loses, even if 'losing' is a reflection of having been a winner many times in the past and even if this 'losing' is not true. Therefore, the previous winners, which is also where the establishment power is, will work, consciously or otherwise, to diminish their perceived loss all of the time, effectively working to prevent any levelling to occur. Which would change if they were persuaded to move or in any other sense support the changes required.
I have copied table 7.2 from [2, p326] here. It points to an issue that is hard to resolve in any way, how to deicide where is 'left-behind'. There is a sense in which, at the prospect of having state money thrown in your direction, everyone is likely to start shouting 'me, me!', so we have need for some pretty definite rules so that we recognise who is advantaged and who disadvantaged. We have seen some of this exhibited in arguments over money for moving into tier 3 of covid restrictions and one can to an extent sympathise with the state wanting to make one size fit all, even as they might simultaneously agree that this is not fair.
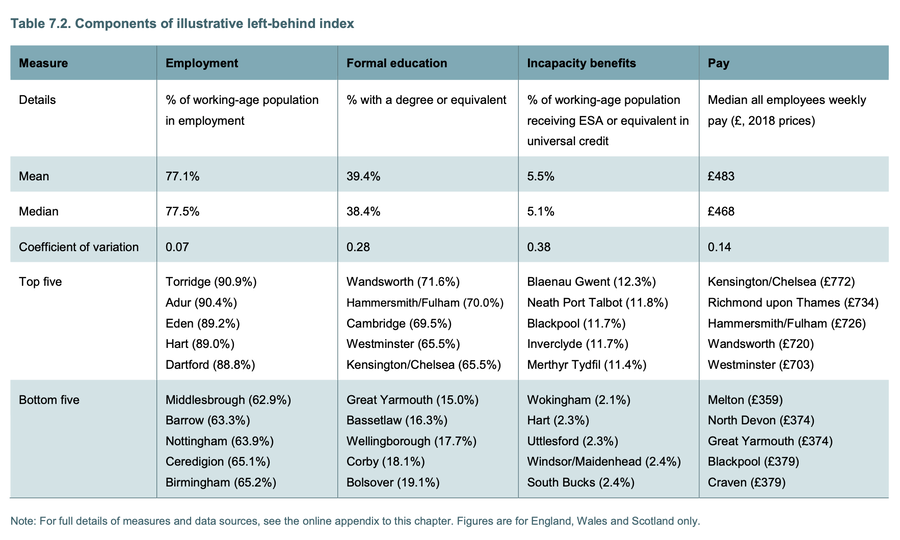
The sort of thing that points to 'left-behind' are:
• Skill levels, which might be measured with the level standards illustrated in essay 312, among others. Source 2 chooses to point at degree-equivalent numbers (level 5, I think), but could just as well point at levels 3 and 4 and at an approach that dealt with that as if a separate issue – in my mind, there's a justifiable need that can be dealt with at a local level and fund that from a pot called 'education'.
• Employment is another measure, where levels below 65% exist, way different to the national averages (pick one). Pay—the median for a local authority area—ranges such that the highest is twice the lowest. One should recognise that pay is not the same as living standard; pay after tax and housing costs might be a more useful measure.
• Third, we could look at benefits and credits as a measure of the health of the workforce and again my instinctive reaction is to deal with that as a strand of 'what needs to be done' and fund it from 'health' monies. The political issue here is that the perception is that benefit somehow displaces productivity, when it would be altogether more healthy all round for recipients of benefit to be given a lot more assistance to become (and stay) productive, changing that image in a way which is seen as inclusive.
• To these indicators (used by [2]) we could also look at productivity (value produced per hour), housing quality, crime rates, outcomes for children (social mobility), but I suspect these are muddled and muddied, being reflections of the topics already mentioned - valid, addressable, but not separated and perhaps not sensibly separable. If they were, I'd like to see them addressed as if separated.
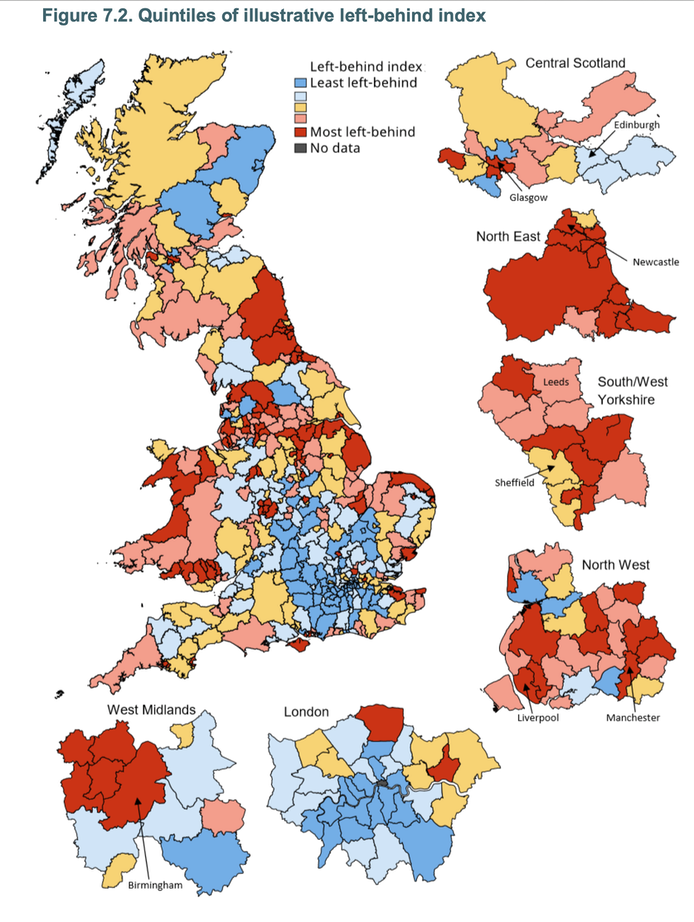
I find it quite disturbing that each of these measures leave the southeast corner around London looking good (the exception being low employment around London). The north of England and much of Wales perform badly on all measures. Source [2], which is really quite readable, then categorises these left-behind areas (look at the map) into quintiles and points out, as any geographer would, that these are coastal towns, places where industry was once a significant employer, many isolated rural areas (pale pink countryside such as Cornwall) and some large towns outside that capital ring (the blue ring around London). The dark red is the bottom quintile by this measure and that ties in nicely to the O'Brien recommendations above.
I am struck by the places where there is a red patch adjacent to a blue one, which I see as a localised problem quite different from the widespread red such as in the north-east. However, I suspect that if one looked at far smaller units (again, as we do with covid), we'd see the localisation of deprivation and disadvantage show.
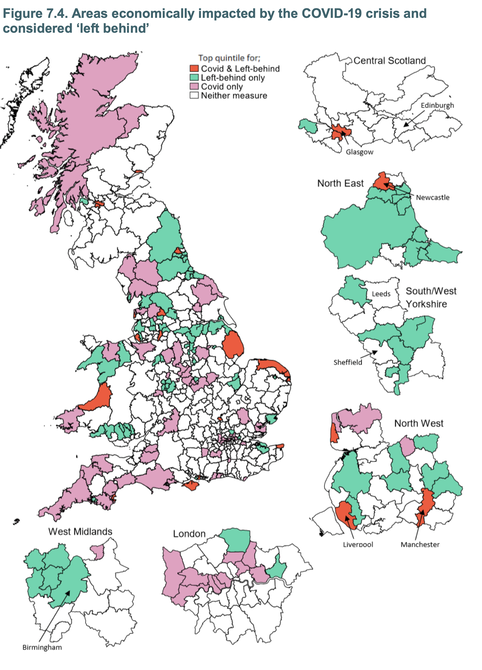
I am also struck by the feeling that both Brexit and Covid hit these same red areas harder than the blue areas, particularly in an economic sense. I do not think the colour is politically motivated, but I did have a twinge that asked if it might be. No, the red is used to indicate that action is needed, hot, and that for the blue it is not needed, cold. I don't see the need to discuss why this overlap applies, but you could read the linked sources for yourself. You might look at, for instance, who was furloughed where, how job vacancies changed, how many sites ceased trading, who was eligible to receive treasury money but didn't enrol. This results in a map (to the right) looking at overlap, which might cause a politician to say "Let's start here" so as to see what can be fixed, what it costs, how to go about it and so on. I note specific parts of cities (Liverpool, Manchester, Newcastle, Glasgow), rural patches in Norfolk, Wales, Lincolnshire the IoW, plus, still to my surprise, Blackpool and what I think is Burnley. You can have fun identifying the places I did not mention.
In terms of action, there are some which are direct, such as attending to health, benefits and education. Those are underlying problems in long-term need of attention—they have been left unattended for decades. There are ways in which the government could direct spending so as to move value away from the south-east. I think of this generically as encouraging devolution. Observers point to things such as investment in transport (while I think 'infrastructure', a larger topic) and look at historical such spending, which exhibits the same trend, to concentrate around the capital. Looking at the five years from 2014 to 2019 London stands out as a focus of spending, even when expressed as spend per head. To have a feel for the scale of this spend, As an illustration, if the government were to take a literal approach, and raise per-person transport investment spending across the UK to the London level, it would require more than £22 billion of additional spending per year – more than doubling the existing budget. Per-person spending would need to more than treble in Yorkshire and the Humber and more than quadruple in the East Midlands. This is absolutely not prescriptive and is merely intended to illustrate the scale of the gap between London and the rest of the country. Clearly, increases on this scale would not be sensibly achievable over a short-term or even medium-term time frame.
Part of the problem here is that there is a sort of self-perpetuating cycle, that invests where there are already jobs, high population and high property prices. I think of this as a trend towards the money. It is difficult to set up incentives for the reverse - it sounds easy in principle but their is evidence that this is difficult in practice (or else we'd have done it).
I've left this for a week and I find I have no more to say. I read about 90% of all of the referenced pieces [1-5]. I would be very happy to have feedback mailed to me at the obvious address. Scons.net has become https:/ rather than http:/ this week.
DJS 20201022
1 Issue of alright vs all right. I see the opportunity for a fine distinction: alright being okay and not in any way unwell, a British greeting regarding wellbeing; all right to mean we're all correct, all correctly presented or somehow all positioned on the right. When we mean we're all well, I say to use the contracted form. American dictionaries have declared this to be an informal contraction, as if it is wrong to use in written work. I wanna see them drop gonna long afore 'at, alrigh'?
[1] https://www.ukonward.com/measuringup/ The O'Brien report.
[2] https://www.ifs.org.uk/publications/15055 Alex Davenport and Ben Zaranko. The top chart is from here. The whole chapter is here as a download. https://www.ifs.org.uk/uploads/CH7-IFS-Green-Budget-2020-Levelling-up.pdf October 2020, so it has not aged at all.
[3] https://www.centreforcities.org/publication/levelling-up-local-government-in-england/ I find myself readily agreeing with this, but then I'm not arguing for anything similar but different.
This report’s proposals are designed to show how the Government should use its forthcoming devolution white paper to end nearly half a century of underpowered and weakening local government in England.
Everywhere will reform — all two-tier systems will be reformed to become single tier, while economic powers held in the lower tier of Mayoral Combined Authorities will move up
Everywhere will have a directly-elected leader — voters will have a clear choice about who will be in charge and they will have clear four-year mandate to act
Local government boundaries will match local economic boundaries — they will always be blurry, but the aim should be to contain as much of the local economy within the local authority area as possible — that is the area over which most people locally work and live their lives
Local government will have the capacity to govern effectively while remaining local — economic powers should be held by local governments covering at least 300,000 people and no more than 800,000. This is to strike a balance between covering the local economy and maintaining a connection with local people and businesses. Lower-tier authorities in Greater London and where there is a Mayoral Combined Authority will focus on personal services and may be smaller than 300,000 people.
Level up to London — every single one of the new authorities and the metro mayors should have the same powers as the Mayor of London
Protected powers for local government — a commitment from central government not to remove powers from local authorities without their consent, similar to the safeguards in Scottish devolution
Greater control over council tax and business rates
Remove restrictions on how revenue from sales, fees and charges can be used
A clear transition to self-funded local government — so that central government begins to withdraw from the process
Fiscal flexibility — changing the way local authorities have to balance their budgets and account for spending
Reforming the centre — replacing the Ministry of Housing, Communities and Local Government with an ‘England Office’ and switching staff and resources from central to local
[4] https://www.policyconnect.org.uk/research/level-industry This report is about 'levelling up' for industry. It makes five key recommendations:
- A long-term national productivity target for industrial growth, supported by a strengthened Industrial Strategy Council, on a statutory footing.
- Strengthened support for cooperation between LEP areas to identify synergies and grow UK supply chains
- Better targeting of the increasing R&D spend to maximise return on investment in the regions of the UK outside of London and the South East
- Enable SMEs to access the technology to improve their productivity and prioritise skills that meet the demands of the sector
- Ensure UKSPF is flexible and can be allocated by local leaders to ensure local and regional demands are met
https://www.dannykruger.org.uk/sites/www.dannykruger.org.uk/files/2020-09/Kruger%202.0%20Levelling%20Up%20Our%20Communities.pdf A different MP's view, this time Danny Kruger MP One ought to read this, but it is 50 pages. I've copied the recommendations only, quite long enough on their own. I'm afraid that almost all of this escapes me for many reasons, most of which are based on a lack of understanding of what is intended to be achieved. I'm left wanting to know why anyone thinks these functions are necessary; I'm not saying they aren't I'm saying I don't see the need. In consequence I write this off as entirely political while at the same time wondering how that is so. It's more than foreign, to me. Perhaps you need to read it. And then write to me.
Power
1. New official measures to understand and track the economic and social contribution of civil society
2. Comprehensive and comparable data from government and civil society about what funding goes where, and what outcomes are delivered
3. Negotiation with Big Tech firms to finance and co-design new, non-proprietary digital infrastructure for communities
4. A new commitment to ‘social value’ commissioning, considering the whole of government accounts rather than a single budget
5. A Community Power Act, creating the ‘Community Right to Serve’ by which community groups can challenge for a role in the design and delivery of public services
6. Community Improvement Districts or ‘pop-up parishes’ with time-limited freedoms and flexibilities to deliver community-led change
7. A new national institution to help local places and organisations improve performance and exercise greater responsibility; and to build an index of social infrastructure that can inform both national and local policy making
People
8. A Volunteer Passport system to match the supply of and demand for volunteers, with options to: join a new National Volunteer Reserve to help with future emergencies and with environmental projects; deliver ongoing mutual aid to people in crisis; fulfil formal public service roles such as magistrates or charity trustees
9. Service opportunities for young people, funded through the Kickstart programme, to work on a variety of social and environmental projects
10. A new deal with faith communities, by which government supports a greater role for faith groups in meeting social challenges
11. An annual ‘Neighbour Day’ bank holiday to celebrate communities’ work together; and greater use of the honours system to recognise the work of communities as well as individuals
Places
12. Planning rules to promote the creation of social capital through good design, the recognition of the need for gathering places, and community ownership of public assets
13. Policy to support independent social infrastructure, including professional ‘connectors’ charged with linking local services together, and physical hubs to co-locate services and enable gathering
14. A new focus on the modern local library, often community-managed, delivering business start-up support and digital inclusion for local communities
15. Policy to make it easier to start and run a charity, and create a modern version of the local Council for Voluntary Service (CVS)
16. A ‘match trade’ scheme to support social enterprises, which play a crucial role in economic and social development in disadvantaged communities
17. Options to boost philanthropy, including civic crowdfunding, and social investment
18. A new £500m Community Recovery Fund, financed by the allocation of the dormant National Fund, for charities and community groups supporting the transition from the ‘response’ to the ‘recovery’ phase
19. Consult on the use of the £2bn+ which will shortly be available from new dormant assets: options include a new endowment, the Levelling Up Communities (LUC) Fund, for perpetual investment in long-term, transformational, community-led local projects in left-behind areas
20. Review the National Lottery Community Fund, which is now 25 years old, with a view to a more local and community-led distribution model.
[5] https://www.centreforcities.org/levelling-up/ leads to several other reports, each of which is worth reading.
____________________________________________________________________