
Having written about smart meters and in so doing rediscovering the spend we make on energy, I was struck by the steady rise in our expenditure on communications, which is a similar figure to the spend on energy. Here I have a look at the information on our general spend on that.
I have looked at the accounts for the last four years and three different houses and, not including hardware, we have spent £5015, which makes the average annual spend to the nearest £5 very much the same as the energy costs of the Wallsend period. So it would appear that the spend on communication is a similar number to that spent on energy.
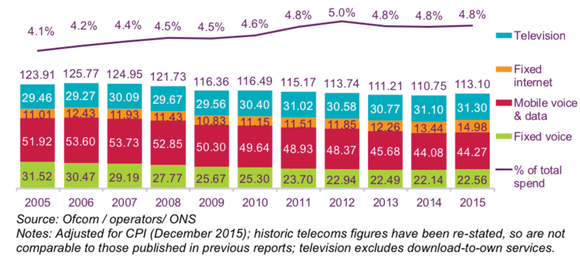
The coloured graph is from Ofcom [1] and shows a typical monthly spend per household on the top of each column, suggesting £1250 to £1500 per year for the period – and these figures are not including capital expenditures (e.g. movies, phones, hardware), nor repairs and maintenance such as upgrades/renewals to software.
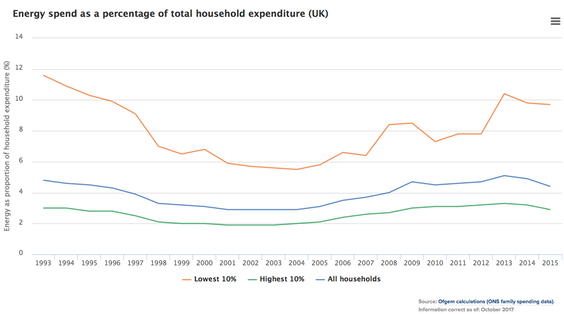
With surprisingly little difficulty I found a similar graph from OfGem, showing that typical energy expenditure (the middle line) was 4.4% in 2015 (lower than comms) but 5.1% in 2013 (higher). You can see the trends in the two graphs, though essay 243 discovered a likely jump in gas price, and therefore total energy costs, expected in 2018.
It looks to me as though calling these two expenditures as similar expenditure per household is a reasonable statement. Note that the lower graph, from OfGem, shows the increased energy costs to low income households.
I found an equivalent graph to the top one for the US, showing greater growth at around 10% per annum from 2006 and 5.5% every year in the previous decade; there are no guarantees these are measuring the same thing, of course.
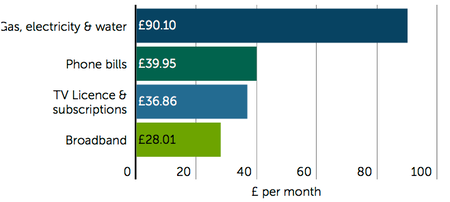
This smaller bar graph is from the Scottish Friendly Society, found on the Money Advice website [4]. Note that these figures put telecomms at adding up to £104.82 compared to £90.10 for energy and water, so more than 15% higher, assuming everyone has all three. The linked site points to things you might do to reduce these bills.
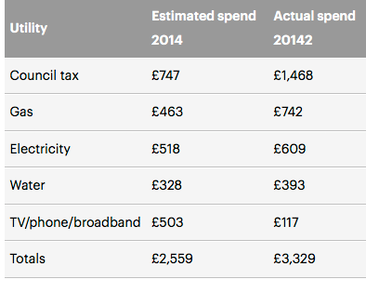
Santander did a similar study (the grey table) which disagrees markedly. The reaction suggests that £117 (for comms) should be £1170. Their report—the one I found—uses the term household bills to include Council Tax, TV, phone, broadband, gas, water and electricity. Rent and mortgage payments were excluded from the analysis.
DJS 20180120
Me-me-me context:
Back in Wallsend, for which I have complete figures because I ‘did’ the accounts for the period, we used annually just under 3700kWh of electricity and between 8500 and 11500 kWh of gas. The electricity dropped off quickly when the PV solar installation kicked in, so that the next year looked as though we would use under 1300kWh from the grid; call that a third of the previous figure. See essay 218. The end figures also dropped as occupancy fell. Annual energy cost about £1250, dropping rapidly to £800.
Meanwhile communications costs ran at £1125 before we include repairs or replacements, so a very similar number.
For the Stockport period we had no tv licence and used P-net since Virgin was not available, and so we had in consequence a much reduced comms demand, totalling £550 (yes, half as much as before) before we include repairs and replacements. Software support for the hardware runs at around £200 per year. Meanwhile, fuel worked out at 1650kWh of electricity and 5950kWh of gas, per year. Which, the accounts say, was about £1000 per year.
For the Blackpool period we are running the tv on FreeSat and using P-net (still no Virgin), and we seem to be using around £800 per year. Fuel bills—and this house is COLD so far—suggest we will use 2000 kWh of Elecy and 9000 kWh of Gas in the year. That’s before my insulation programme kicks in. That’s also a lot of heating to very little effect. 2021 update shows use has changed to 3200 KWh/yr Electricity and 10400 KWh/yr Gas
Edit 20200504
What I call communications costs excludes capital spending but includes all our recurring telephone costs, our broadband charges, storage services for the computers (Dropbox, Microsoft, Zoom, Apple - all the recurring charges); I'd include the tv streaming services (tv licence, Netflix, Sky, Amazon etc., but we don't use them at all). I don't include any repair costs and I don't include capital costs like new equipment, even when it is replacement. On the energy side I should include the parallel recurring costs such as boiler servicing, but we do that every third year not annually as the provider would prefer.
For the period 2014-9 the total spent on energy and on comms was almost the same, at around £5000; for much of this time we had solar panels providing savings and income but we also had two houses for about a year in total.
In 2020 the situation was quite different, £1250 on energy, £750 on comms. Solar panels installed but no export income; a very much bigger house 3-4 times the volume, for slightly lower household temperatures. I can see an argument for measuring energy as per square metre or per avaerage house size (which is 85m²); I've tackled this below.
The national average for energy is quite easily ascertained. The equivalent figure for comms is not so easily found, as it is separated into muddled components that i think should be grouped. A reasonable estimate can be found by looking at the cost of a comprehensive package from a supplier like Amazon, Sky or Virgin, but that wousl still exclude the data storage and system maintenance costs I rack up on the computer(s).
I suggest a typical comms cost is approaching £100 per month – Sky, £28-100 but add phones separately: Virgin £55-63 includes phone; mobile phone average £440 per year (and rising). So we might look at £900 - £1200 as an expected tv/broadband/phone combination.
I also pay for Microsoft by the year £80, my website hosting £80, mobiles (we're dead cheap, under £50 per year), wikimedia donation say £15 per year, newspapers (again, miserly) £70 per year (but I've excluded this in my numbers), internet security system £100. So our computing adds £300 a year reguarly. For us: Tv Licence £160, PlusNet broadband for the year £250-£350, all making £750 a likely figure for the year quite likely.
Our energy bills vary with the residence. I've shown the Wallsend 115m², and Stockport 67m², houses but for the Blackpool 290m² we average £100 per month, £1200 per year. Looking at the three houses and at £/m² year, then Wallsend ran at £10, Stockport at £15 and Blackpool at an amazing £4 - but we do have a lot of the house amazingly cold in the winter such that we have nowhere good for houseplants. I think we'll choose to push the rate up to £5/m². Rather than quote the annual accounts I've added up the fuel for the period we owned the house and worked out the annual total. Bearing in mind that energy is increasing in cost, we're doing quite well in improving the gap between acceptable temperature and spending. I view the Blackpool house as very poorly insulated, though these figures suggest we have found a good balance.
Reversing the measurement and looking at total expenditure, I have:
2014 £1950, 2015 £1360, 2016 £670 (or £3400 with the IT purchases), 2017 £1030, which suggests an average running cost for tv, phones and computers of £1250, not including the latest hardware purchase.
[1] https://www.ofcom.org.uk/__data/assets/pdf_file/0028/98605/Pricing-report-2017.pdf well worth a proper read.
[2] https://www.ofgem.gov.uk/data-portal/energy-spend-percentage-total-household-expenditure-uk
[3] https://www.ons.gov.uk/peoplepopulationandcommunity/personalandhouseholdfinances/expenditure/bulletins/familyspendingintheuk/financialyearending2017
[4] https://www.moneyadviceservice.org.uk/blog/how-much-do-you-spend-on-your-household-bills
[5] http://www.thisismoney.co.uk/money/bills/article-2834909/Do-know-spend-bills-Households-underestimate-yearly-spend-utilities-council-tax-770.html
[6] https://www.santander.co.uk/uk/infodetail?p_p_id=W000_hidden_WAR_W000_hiddenportlet&p_p_lifecycle=1&p_p_state=normal&p_p_mode=view&p_p_col_id=column-2&p_p_col_pos=1&p_p_col_count=3&_W000_hidden_WAR_W000_hiddenportlet_javax.portlet.action=hiddenAction&_W000_hidden_WAR_W000_hiddenportlet_base.portlet.view=ILBDInitialView&_W000_hidden_WAR_W000_hiddenportlet_cid=1324583259913&_W000_hidden_WAR_W000_hiddenportlet_tipo=SANContent
Tip: if you are worried about internet security, have a look at setting your DNS at 9.9.9.9. Look for Quad9 on the ‘net. Site. Free.