
Correlation and causation are often confused, as if there is a substantial fraction of the population that assumes that any correlation must have cause.
Establishing a correlation is relatively easy. Many with an A-level in Statistics or equivalent have known at some time how to prove this. Without knowing all the maths it is not difficult, explained in the separated box.
One way show a correlation:
Put your data into Excel in two columns, preferably adjacent columns.
Select your data and create a scatter graph.
Ask Excel to plot a line of best fit (which it may well do automatically).
Enquire from Excel the numbers for that line.
Example below.
Here is an example I made this morning. I found a correlation of 0.888 between the divorce rate and smoking – both are rising. I do not need to know any stats, only how to use Excel, and you can flounder through that once you’ve seen what I produced – choosing the chart type, changing the scales, labelling the axes – none of this is difficult.
The nearer the R² is to one the greater the correlation (it measures how close the data points are to the line in a clever way). ¹ Interpretation depends on context and purposes (wiki).
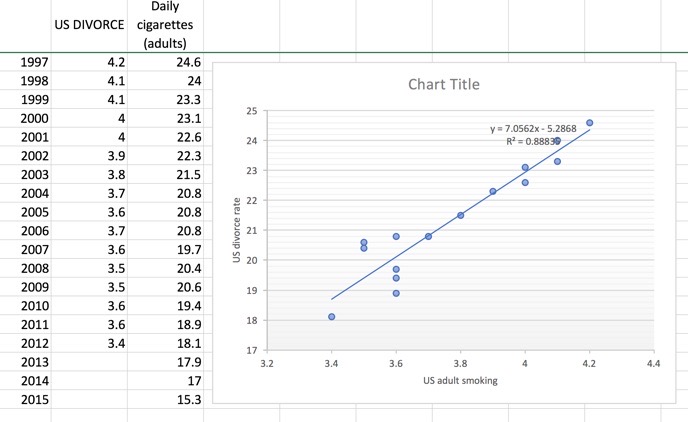
Y-axis data from https://www.infoplease.com/us/marital-status/marriages-and-divorces-1900a2012
X-axis data from https://www.cdc.gov/tobacco/data_
statistics/tables/trends/cig_smoking/index.htm
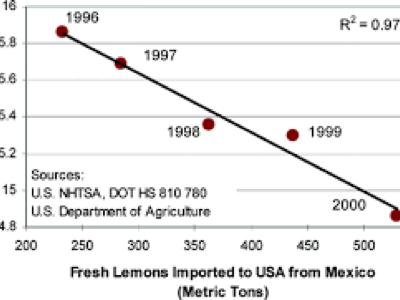
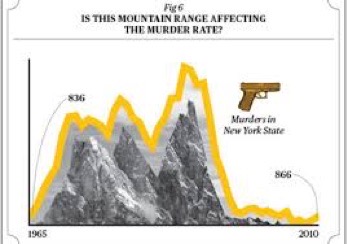
For other correlations that might make you grin—or wince—see sites such as this one and this one. Mark Wilson shows powerful correlation between divorce in Maine and the (Maine implied) consumption of margarine, and then between the age of Miss America and a particular class of steamy murders. Simply because he can. The second site correlates death with unlikely events – the sort of thing I’d have set as a homework if still in daily teaching. ² Go on, you produce one and share it; I’ll add it in here.
You do not seriously think these things are connected, do you? If you did, which way round would you express the connection? Is it the divorce that causes the smoking, or the smoking that causes the divorce? Is it the margarine that causes divorce in Maine or the other way about? As for Miss America…. The lesson here is that
Correlation does not imply Causation.
Even something that short is too difficult for some, so, if you need to, sit and say it to yourself a few times. I think I’d get a Stats class to do this primary school activity only after they’d shown they still were falling for confusing the two. It is not true to reduce this to “Correlation is not causation”. Wikipedia quotes Edward Tufte in suggesting that we need to add “but it sure is a hint”.
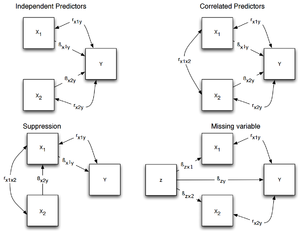
The causes of the logical error lie in how we view A~B, indicating a connection. Using the symbol => for ‘causes’ and hence <= for ‘is caused by’ the cases include (I hope to have been exhaustive):
A => B Speed on the road causes death. No; excessive speed causes death rather than injury if/when an accident occurs.
A <= B As wiki says, economic growth slows when state debt rises over 90%. Deciding that high debt causes slow growth is wrong. We can argue that slow growth causes growth to increase.
A <=> B Either at the same time or in turn (A makes B happen, which makes A happen...) E.g. Pythagoras works, so it is a right angled triangle. Since it is a right-angled triangle, Pythagoras applies.
C => A and C => B Consequences of a common cause. Spring causes flowers to bloom and storks to fly. That does not mean that the storks affect the flowers. Or the flowers, the storks. The wiki article has good examples that typify the sort of thing ‘we’ think we have read: Sleeping with one's shoes on is strongly correlated with waking up with a headache; Young children who sleep with the light on are much more likely to develop myopia in later life; Since the 1950s, both the atmospheric CO₂ level and obesity levels have increased sharply. I do hope you didn’t read causation into those statements.
A => C and B => C They both cause C to happen. They may not even be correlated. Starvation causes death; War causes death. War and starvation may cause each other sometimes, but not always..
A => C => B C is an intermediate state. Too often I have seen and heard arguments, where the connection is correlation A to C and C to B, that A causes B. Unlikely to be true. A may be one cause of B, but it is not automatically the only one.
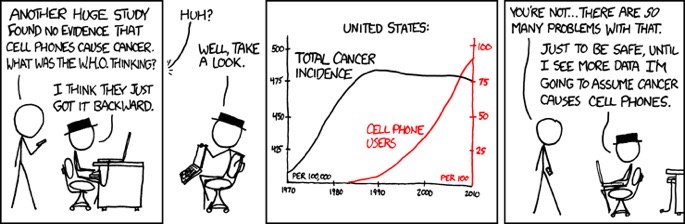
And there is coincidence, where the original premise A~B is untrue. See —>.
Particularly, let us be clear that A causing B is not automatically exhaustive (all A cause all B) It may well be true that all A cause B, but that doesn’t mean the only way for B to occur is through A happening.
A tends to produce B is a probabilistic statement such as we find increasingly in medicine, along the lines of ‘obesity does not correlate with operations success’’. It is not that the op fails, but it is less likely to succeed. In a climate where measures of success demand value for money, there comes a point at which the marginal nature of the success is too low for the resources to be expended. To put that another way, the expected total expenditure (consumption of resource) is reduced by approaching such a problem from a different direction, such as reducing the body size first – in effect saying ‘This other problem needs to be dealt with first’.
In particular, if we have causation, A causes B, then of course we expect to see correlation. Correlation may or may not imply causation. It would be untrue to say that correlation never implies causation. Look up 'woo spinners’. [here, for example, under fallacy engineering]
What really makes causation? It occurs pretty directly in a lot of science (or at least that is the logic we apply) using mechanisms local and indirect to explain why it is that A causes B. We pay great attention to the apparent exceptions and use those to inform ourselves of how the previous model needs correction. We all (supposedly) know Pythagoras’ Theorem,³ but too many of us forget to apply it only to right angled triangles and, even among those who do, there is a further assumption that the two-dimensional space is flat – not a curved surface. See Essay 180, Dementia.
Which makes me wonder if the root cause of this fault is to do with the way we teach mathematics. The place where we apply cause as a rule and then depend upon it for arguing that this means that. And then we spend ages making sure that the proof is necessary and sufficient.
Perhaps this is why we should fight to keep ‘proof’ within the curriculum? Perhaps instead we need cross-curricular use of terminology – I’d like to hear the same language used in a Literature lesson for example, or in History.
DJS 21070629
top pic from Oregon State
Working through the whole collecion in 2017, I came across [8] Additive noise testing. The point is that Additive noise model testing is based on the simple assumption that there is always some statistical noise clinging to the key variables in any experiment—areas where the data becomes fuzzy and unreliable due to measurement errors. Regardless of any link, each variable will have its own unique noise signature, with one caveat: If X causes Y, then the noise in X will be able to contaminate Y, but the noise in Y will not able to do the same to X. Because a cause can affect an effect, but an effect cannot affect a cause (read that last line a few times).
This is quite correct, and it may be the very thing that rattles us all when trying to do Statistics to show a connection, very much the same as deciding which is the dependent variable in S2 work. As [8] explains, it is the inspection of what happens to the noise values that tells you whether there is correlation or causation. The essence of the argument [9] is that in any set of measurements there will always be noise from various causes. The key assumption is that the pattern of noise in the cause will be different to the pattern of noise in the effect. That’s because any noise in X can have an influence on Y but not vice versa.
The research so far says this is 80% successful in cases where one variable (really does) cause the other; that is, your observational data may indeed show cause. Original paper, 2014. Also, an earlier one, 2009. Work continues, 2017 paper.
I would teach some of this to FM classes. I think that what one would do, within A-level skill-sets, is to look hard at the data away from the correlation line, calling this the noise. Then to inspect what the noise in the x-values does to the y-values, and what the noise in the y-values does to the x-values. Perhaps, even, to do that which is frowned upon and change the decision which is the dependent variable. I suggest that when causation occurs, the r² value is dramatically lower. More, I suggest that identifying the right set of noise will improve the correlation dramatically. In effect, one is inspecting the outliers to see what the system response is and then deciding which to exclude. That is my simplistic version of what reads as extreme research. Definitely a call for interpretation (please).
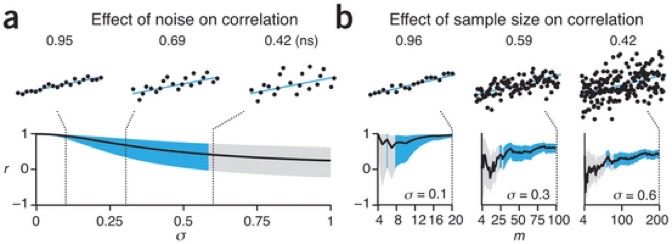
1 There’s a test to establish ‘confidence’, based on the number of data points. For this sort of case I have 16 pairs of data so 14 degrees of freedom, so anything above around 0.6 is really significant (search for a Pearson’s correlation coefficient table and read it for yourself). Excellent image from here and above to the right shows how correlation becomes stronger with more data.
2 Go on, you produce one and share it; I’ll add it in here. Do as I did, give the sources. You don’t have to give me the data. I used a screenshot to capture the image, which is (I have found) the quickest / easiest way to add to my webpages. Making a spreadsheet ‘live’ on a webpage is still beyond me. By which I mean it is more work that I can justify, even with allegedly having nothing to do all day. If you are amused and only want to see more such examples, Google ‘correlation and causation’ and choose images.
3 That no matter how many vestal virgins there are in the temple, they will disagree. Anyway, Pythagoras probably preferred boys. “Archimedes was monogamous, not Pythagoras. And no, I didn’t know either of them personally. I’m not that old. Really.” Quote from lessons across many years.
I missed out the “Sites Used” list, added in 2017:
[1] https://en.wikipedia.org/wiki/Correlation_does_not_imply_causation Good old wikipedia; I hope you contributed this year!!
[2] https://rationalwiki.org/wiki/Correlation_does_not_imply_causation
[3] https://www.fastcodesign.com/3030529/hilarious-graphs-prove-that-correlation-isnt-causation Oh no it isn’t…..
[4] https://medium.com/@akelleh/if-correlation-doesnt-imply-causation-then-what-does-c74f20d26438
[5] ttp://www.slate.com/articles/health_and_science/science/2012/10/correlation_does_not_imply_causation_how_the_internet_fell_in_love_with_a_stats_class_clich_.html
[6] https://science.howstuffworks.com/innovation/science-questions/10-correlations-that-are-not-causations.htm
[7] http://www.tylervigen.com/spurious-correlations I liked these.
[8] http://www.vocativ.com/335705/correlation-causation/index.html This may give you a headache. Additive noise model testing.
[9] https://medium.com/the-physics-arxiv-blog/cause-and-effect-the-revolutionary-new-statistical-test-that-can-tease-them-apart-ed84a988e Readable
[10] http://proceedings.mlr.press/v9/peters10a/peters10a.pdf Not readable, along with the other papers I have linked.
