
Those who know me, even only slightly, know I need to go running. It fixes what’s gone wrong at so many levels: it puts worries in perspective, it gives the ol’ bod a workout and that usually fixes practically everything medical. It doesn’t make my head have hair, but it does a lot for me.
So you can appreciate how I feel about finding that the kids are in school at break-time; frustrated. Why are they inside? Because the Air Quality measurement has passed 250. What is one of those?
The first time I met the figure I had, habitually, been running the day before. As has happened with every After School Activity from November to February [ASA, in BSB English], no kid turned up to run with me, so I did a 30 min run in the cold, not liking that I felt I could taste the air, but putting that down to the temperature and too much coffee.
Not so; I was apparently out when no-one else was stupid enough to be out, at an AQI reading of 350. But you still don’t know what these numbers are. I’ll share what I found out:
Monitoring stations measure CO, SO₂, NO₂, O₃, H₂S and particulate matter, particularly (ha) PM2.5 and PM10. The PM units are micrometres (microns). These are small enough to stay in the lungs. I don’t like the sound of that. [ppb = parts per billion, ppm = parts per million and µg/m³ = micrograms per cubic metre.] The ozone makes people sick, probably because it is created when poisons react in sunlight; it is probably the poisons that make people sick, not the ozone itself, since we celebrate exactly the same ozone stuff when at the beach. Carbon monoxide is created from inefficient burning and is directly poisonous, reacting with haemoglobin. All nitrogen oxides are bad for us, but the dioxide irritates the lungs (making nitric acid) and leaves the red-brown colour in the atmosphere. Hydrogen sulphide and sulphur dioxide also come from burning, burning coal and oils heavy in sulphur, and the results, in wet air, continue to make things bad [chemist and medic response please]. Both the NOx and SOx produce acid rain; noxious and soxious.¹ AQI refers to the air quality index for a particular pollutant. AQHI relates to the pollutant and its associated health risk.
Beijing has many coal power stations; there was a time when I was in Xi’an when my brother recognised and confirmed a comment found elsewhere by me that there was a new coal power station opening somewhere in China every week. Even if they were small, that’s a lot. There is very little in the way of control and I have several times been told by a cynical local that it is cheaper to pay the fine than to fix a problem; buying the local official is considered even easier [but please note that, since no-one is openly prosecuted for being bribed, this could be merely sour grapes jealousy of the person with a job-for-life, just as it could be description of graft].
In Britain DEFRA, the Department for Environment and Rural Affairs, has some directly informative material (neat, that; pleated pin-stripe, then?). Of 128 sites included in the report I read, 121 reported low and 7 failed to report. The annual national reports are available (uk-air.defra.gov.uk), for example. So of course I downloaded (very slowly) the 2011 report to read at leisure. Which is what writing time is, of course.
I quote from the DEFRA report of 2011 in this colour. Additional bits by me are in [brackets] or back into this colour. You really should read it for yourself and then write to me with what you think significant.
The updated Strategy [of 2007] acknowledges that for PM2.5, the health impacts of particulate pollution are particularly associated with this fine fraction [lovely expression, fine fraction]. The 2007 Strategy introduced:
An air quality objective for PM2.5, which defines the maximum acceptable concentrations for public exposure. The objectives for annual mean PM2.5, to be met by 2010, are 12 μg m⁻³ in Scotland (where levels are typically lower) and 25 μg m⁻³ for the rest of the UK.
Okay, target is under 25 μgm-3 for PM2.5. Note that there are few exceptions to meeting the targets and action (even if only a public explanation) is demanded where 35 is exceeded. Read on for levels in China!!
The UK currently reports on the following two indicators as National Air Quality Statistics for ambient air:
Annual levels of particles and ozone. These are the two types of air pollution believed to have the most significant impacts on public health (specifically, long-term exposure to PM10 and daily peak ozone levels).
Number of days in the year when air pollution is “moderate” or higher. This may relate to any one of five key air pollutants and is based on the UK’s air quality index (see section 2.2.3). Until the end of 2011, the five pollutants were nitrogen dioxide, sulphur dioxide, ozone, PM10 particles and carbon monoxide. As of 1st Jan 2012, PM2.5 particles are planned to replace carbon monoxide in this suite of pollutants. (The thresholds used to define “moderate” and higher pollution levels in the air quality index were also revised at the beginning of 2012.)
On particles:
Fine particulate matter can penetrate deep into the airways, carrying surface-absorbed harmful compounds into the lungs, increasing the risk of health effects. In most urban environments, particles in both the >PM2.5 and <PM2.5 size fractions are present, but the proportion of particles in these two size ranges is likely to vary substantially between cities depending on local geography, meteorology and specific PM sources.
The range of health effects associated with PM is broad, but is predominantly related to the respiratory and cardiovascular systems. All of the population is affected, but susceptibility to the effects of PM may vary with health or age. The risk for various outcomes has been shown to increase with exposure, with both short-term and long-term exposure being important. There is little evidence to suggest a threshold below which no adverse health effects would be anticipated, but effects are unlikely to be noticed below about 50 μg m-3 for PM10.
Annual mean PM10 concentrations for urban background and roadside sites are also reported annually as a National Air Quality Statistic. The annual mean PM10 concentration for 2011 across all sites was 21μg m-3.
That last suggests that motor traffic is a likely target and the difference between the background and roadside sites should be producing some good measurement of the localised road effect. [See footnote 5]. Campaigners for less driving will want to point out how bad driving is for your health, even when driving safely. “Driving safely is bad for your health” will equate in my mind with “Competitive sport is bad for you”, also probably true. A graphic is called for! Send me a copy, please.
Britain’s annual average is around 13 μg/m³, where China’s is more like 130.
The draft target for China’s pending air quality legislation is 75μg m⁻³, quite reasonable for a developing country. Read on to decide whether we can manage that in Beijing this month. I hope that is the 2.5 micron figure; as ever, by introducing a second term (even politically) we actually serve to confuse the issue, as everything that went before needs to be reexamined for precision.
I think what we have is a muddle over measurement systems. What I find quite unacceptable is the failure to explain properly. The explanations are clear enough, but all the explanations fail when the systems are not defined - again, well done UK. I think that the 1-10 scale as for Canada² is for Joe Public’s consumption (and he has become dumber, less educated and almost incapable of reading as time has passed). I think the three digit scale refers to particulate matter, but it doesn’t match the UK version with proper units.
Here’s a statement with which I agree completely: “the vague term 'particulate matter,' with no designation of its chemical and physical nature, violates every principle of toxicology." JC Chow - Journal of the Air & Waste Management Association, 1995 - Taylor & Francis
Indeed, I found a wealth of stuff from Taylor & Francis that I’d stand and read in a bookshop like Heffers. Oh, for a university subscription so I could download the stuff without charge.³
Interlude: We had a parent who wanted to quiz staff about the leeway in our action to keep kids in at 250. We’re up front about this; it is an arbitrary value: if we have 250 or higher that day then unless it falls (it generally stays down once it has gone down) we stay indoors. If it is rising, we are careful and will keep checking. But no, if it is 250 or higher we don’t go outside and if it is lower, we do. If it is close and rising, we’ll look at what we do, probably coming in only when the magic value is reached. Clear enough?
How do we check? There’s a weather station at the US embassy (and on the roof, I think); there are two PRC stations in Beijing. The output is available in almost real time and readily accessible – when the internet connection is good, which it is at school, and I wish I understood how they manage that.
How bad is what number? Well, the Beijing median (average, to you) is around 150 thingys. The Canadian scale hits alarms at 8; the US scale gets upset at 150; China gets upset past 500. Those may well be mixed units that should not be compared. Perhaps, but we do compare them anyway.
The American (meaning US) embassy has a twitter feed updating PM2.5 every hour, using the US EPA index. You can access it here. Right now, Friday evening, it is 216, labelled very unhealthy, The China site http://www.aqicn.info disagrees presumably for being located differently. At 10:00 on Saturday, both say 235, so no running outside today. The aqicn site calls Tianjin, at 193, lightly polluted, where 100-150 is called Slightly, and 50-100 Good. Compare this with Britain, which seems to get upset at any number over 50. Including age, come to think of it....
From the US embassy site, we can capture this:
What is the Beijing air pollution index and what does it measure?
The text line (above) is the air quality measurement from a monitoring station in the US embassy in downtown Beijing (depending on your location, you may need a VPN to view this). The station measures PM2.5 particles and ozone. "PM2.5" means particles that are smaller than 2.5 microns in size, like soot from diesel engines. Research shows that these are the most dangerous pollutants. The first part is the date and time. Then comes the measurement, then an index that is calculated from the measurement, then a health impact rating. Anything below 100 is good, anything above 100 is a cause for concern.
How to interpret the numbers?
The most important parts are the index and the rating. These are calculated according to US EPA (Environmental Protection Agency) guidelines
0-50 Good
51-100 Moderate (Unusually sensitive people should consider reducing prolonged or heavy exertion)
101-150 Unhealthy for Sensitive Groups (People with heart or lung disease, older adults, and children should reduce prolonged or heavy exertion)
151-200 Unhealthy (People with heart or lung disease, older adults, and children should avoid prolonged or heavy exertion. Everyone else should reduce prolonged or heavy exertion)
201-300 Very Unhealthy (People with heart or lung disease, older adults, and children should avoid all physical activity outdoors. Everyone else should avoid prolonged or heavy exertion)
The US embassy monitoring station is in the downtown area, in the ChaoYang district, near the NE corner of the 3rd ring road. This is the heart of the expat residential area downtown, so the air quality feed gives a good picture of the air quality for those living in the city and the Lido area. It is less accurate for Shunyi residents living further out of town. Generally the Shunyi situation can be expected to be quite closely correlated with downtown, but is often better overall since traffic density is less. There are exceptions in the winter months however, when coal burning by local Shunyi residents can sometimes make the air quality there as bad or worse than the city.
Big assumption coming up: that the labels moderate and unhealthy can be transferred between systems. I’ve got to do this because I can’t (yet) find definitive explanations of the scales – The British is very clear; the Canadian one looks great but is obscured by sending one to other sites (and I didn’t find the one that told me what I wanted to know, so “pretty but useless” is my conclusion, where I’d describe the British one as straightforward and exactly what it looks like. And its towel is already on a lounger beside the pool just in case some Germans are around.
Today, Chinese New Year, the figure at 08:00 is 222 “Very Unhealthy” (bjair.info’s capitals). I just looked at the US published data http://www.airnow.gov/index.cfm?action=airnow.national_summary and see that Arizona has problems, being the only state I saw with numbers over 80, but the maximum I saw was 100. Not quite believing this I looked a little harder, and found El PAso at USG and Logan, Utah at 118. But the figures don’t have units, so I don’t know for certain that I’m comparing like with like. Data fail, as Jessie would say. But at least we know we’re using the same EPA measures, don’t we? Actually, no, but it is implied, consistent and believable; that last should not comfort.
At http://www.epa.gov/air/criteria.html I found US National Standards. For Particle Pollution, at 20121214, the PM2.5 has primary 12µg/m³, secondary 15µg/m³, where those are annual means over three years and a 24-hour standard of 35µg/m³ to be in the 98th percentile averaged over three years. Which last means, I think, that it will be okay to have a week per year over 35 thingys per whatsit. Whatever primary and secondary means – I guess it has different levels of response from various agencies.
The PM10 figures only have a 24-hour target, of 150 μg/m³, not to be exceeded more than once per year on the three year running average. This might be because the larger particles fall out of the air rapidly (I’m guessing they do that), which would make a long term average pointless. There is a connected document, the menu of control measures, which tells you what can be done to reduce the particulate matter. Would-be environmental engineers should read this – most of the solutions for the particulate matter simply add a venturi scrubber, an electrostatic precipitator or a fabric filter (which I think are all self-explanatory terms). I didn’t know what coal-washing was and it looks to me like it would be a cheap and high-quality solution here in China; interested parties might also look here, Estimation of Coal-Cleaning Costs: A Spreadsheet-Based Interactive. Software for Use in the Estimation of. Economically Recoverable Coal...
So here are some questions:
• Is the 222 of today the particulate measure in micrograms per cubic metre?
• Is the measure of PM2.5 included in the PM10 figure? I can imagine some evil person measuring particles between 9.5 and 10.5 or narrower and calling that the particle count at the 10 microgram level.
If it is bad outside, how bad is it inside? Does our air conditioning actually do any filtering? Note that a/c here means a heat pump for cooling and heating depending on the time of year, and it is likely that the only filtration of the air is for the benefit of the machine.
Ohio, Hamilton County Environmental Services, has some excellent explanation, here. I find (yippee!), written very small
* PM has two sets of cautionary statements, which correspond to the two sizes of PM that are measured:
Particles up to 2.5 micrometers in diameter (PM2.5) Particles up to 10 micrometers in diameter (PM10)
** • An AQI of 100 for PM2.5 corresponds to a PM2.5 level of 40 micrograms per cubic meter (μg/m³, averaged over 24 hours).
• An AQI of 100 for PM10 corresponds to a PM10 level of 150 micrograms per cubic meter (averaged over 24 hours).
Let’s have that again, bigger:
An AQI of 100 for PM2.5 corresponds to a PM2.5 level of 40 micrograms per cubic meter (averaged over 24 hours). An AQI of 100 for PM10 corresponds to a PM10 level of 150 micrograms per cubic meter (averaged over 24 hours).
Now, why was that so difficult? Is this a linear scale?⁴ The EPA site tells me that some sites use 35 thingys per whatsit, not 40, as the 100. That tells us this 100 is 100% of some target. Wrong: Micmac Health Dept says: U.S. EPA set an AQI of 101 to correspond to a reading of 41 micrograms per cubic meter (below the health standard of 65 micrograms per cubic meter), to be more protective of people with particular susceptibility. For PM2.5, AQI levels over 150 correspond to levels over the standard. Now I’m more confused. Do I simply add 60 to the µg/m³ figure for PM, and to which one?
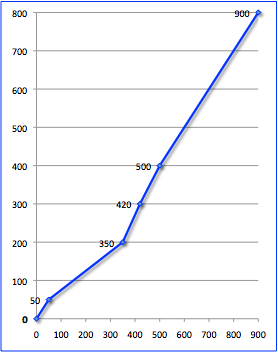
Thanks to Louie Cheng at PureLivingChina.com, who says the PM concentration, now called PMC,⁶ is a linear interpolation between the relevant boundaries. I graphed these points: (0,0), (50,50), (350,200), (420,300), (500,400), (900,800).
The x-axis is concentration and the y-axis is AQI.
From 0-50 they equate, so for the UK there never was a problem (so they have no need to explain, do they?). From 50-200 of API, the concentration goes from 50-350, in a two-for-one way. Once we pass 200 on the AQI/API scale the next 100 on the index are 70µg/m3, so the 235 I read as AQI (API) is 375µg/m³ (200+35=>350+35x0.7 = 374.5), ten times the reaction figure in Britain. From 300 to 400 we scale the next 80, so an index of 360 = 300+60=> 420+60x0.8 = 468μg/m³ From 400 to 500 we go back to 1:1, so the declared 799 from three weeks ago, if an AQI, was an incredible 899μg/m³ , so many times over the danger mark of the west that there’s little point in doing arithmetic with it, though I think I can turn it to good effect at school at several levels, maybe even write a whole worksheet based on what is on this page. Later: I left this garbled version in the Lower School work see Pollution and S1 Pollution.
You might notice that Louie Cheng’s figures do not agree with the Ohio interpretation at the low end. So while I think I have (from him, PureLivingChina) a believable interpretation, it is not definite nor definitive. This is an unbelievably garbled situation, isn’t it?
Having made progress in finding the right questions to ask, I find an excellent, if expensive, paper at httwww.sciencedirect which compares conditions in various large cities.
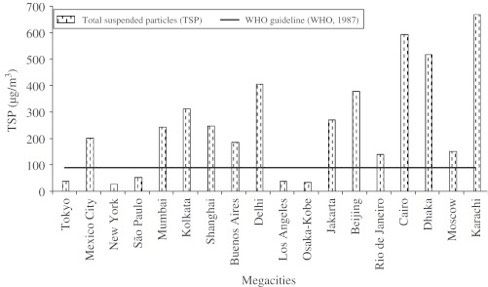
Figure 5 (left) shows the annual average ambient air concentrations of suspended particles. The bold horizontal line shows what non-residents say would be sensible levels. I think residents are coming to agree. I’m disappointed that London is not included.
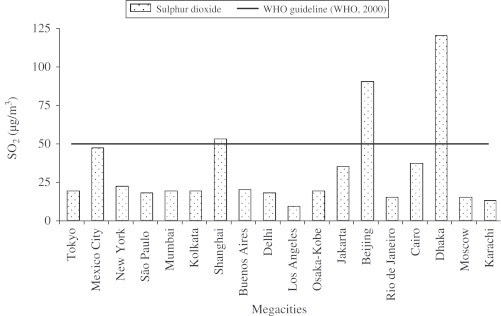
Fig. 3 (right) shows annual average ambient air concentrations of SO₂ in the late 1990s. One notes that Dhaka, Beijing and Shanghai are the only ones above the parapet, and conversely that Karachi and Cairo have very low SO₂ levels - why is that? Could it be a different power supply? A different type of coal?
The paper goes on to coin a megacity pollution index, MPI, picking some (arbitrary, I thought) zero point that separated Rio from Buenos Aires (well spent cash, that Argy), leaving Osaka, Tokyo, San Paulo, LA and NY to the left (well spent counter bribe, Paulo) and, way off to the right, Dhaka, Beijing, Cairo and Karachi. Interesting comparison of KIR (2004), (KIR = knowledge-intensive region) to do with world knowledge competitiveness, with their own MPI (2000), showing a negative correlation.
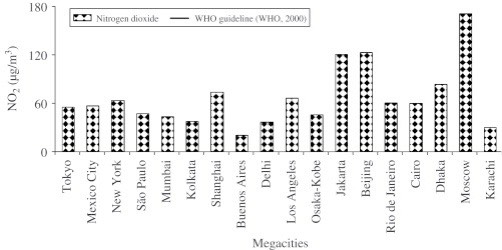
Fig. 4 (left) shows annual average ambient air concentrations of NO₂ in the late 1990s. Moscow and Jakarta jump up, BJ & Shanghai stay pretty prominent.
. I’ve used this in a sheet called Pollution, in the Year Eight webpages, with a link at the bottom of this page.
PureLivingChina.com has a blog well worth reading – it is open in its commercial bias. It is the first site I found answering the question about AQI indoors. The one sample pictured indicated AQIs of 181 outside, 167 inside and 69 after 45 mins of using an air filter. That is 8% less across the the house boundary, disagreeing with the 20% I had quoted to me secondhand from a local (but foreign) inspector. 20% would be 145 indoors - but to reach western standards, under AQI 50, you’ld have the filter running all day and go around sealing doors and windows. Perhaps one would settle for under 100 as a target AQI. I guess that the Chinese passion for air movement (see Fresh Air) will defeat any attempt to clean indoor air below a certain value. [See the differential equations problem to be written later & not yet done]. The air filter machine will reach a level where it is effectively cleaning the incoming air. I wrote to senior management about air filtration in school and the gap between what we know about outside and what we don’t know about inside. If we stop kids going outside at AQI 250, at what point is it best to send them home (by bus, which is probably a worse environment than indoors, but assuming school is worse than home?; perhaps school should be ‘safer’ than home?. I have discussed (with fellow staff) air filters being in the gym / fitness rooms (more effective in the latter, being smaller volumes) and it is a question to raise in every gym in China. So, answering a point posed earlier, the target of 75 is even difficult to achieve indoors using a filter in Beijing at the moment.
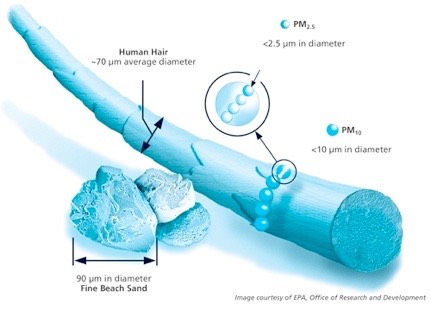
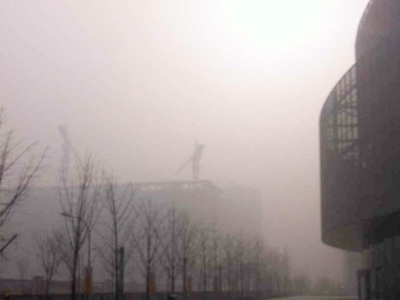
Diagram left here taken from the EPA website (Oregon’s copy) shows relative size of the offending particles, too small for the body to expel, so it will find its way into, especially, the lungs. Not good; once in, it is staying there. Not like lead poisoning, which to a large extent we can cure ourselves of by moving to a less polluted environment. The two photos below are from NASA, Jan 03 and Jan 14, found here, records the levels “over 700”. Our local index reached 799. The NASA comment is that the sensor was reading PM2.5 of 291μg/m³ at the time of the Jan14 picture. Jan 12, AQI peaked at 775 and PM2.5 was 886μg/m³.
Time for action by all.
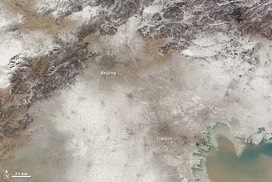
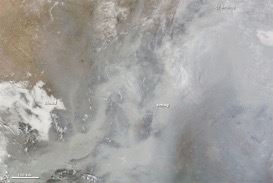
These are the two NASA photos described above.
It was reported in the Common Room that seven factories (just seven was enough) were told to cease production for a while, with the effect of halving the figure within 12 hours. That seems to me to say many things about long-term and sensible action.
As it happened, two colleagues were using the opportunity to good effect in teaching science. One colleague made sticky cards (vaseline wiped on postcards) and left them on fences and tree trunks over the weekend; the class then put these under microscopes and counted particles. Another took a sample of snow and tested the pH. The particles were easily seen and counted, but no-one knew how to relate the count to anything we collect of the internet. The other reading was 3.5, which is a decent acidity in the lab; I suggested we bottle it before it has all gone and add to the reagent collection. HCl, H₂SO4, BJ Snow....
All of the above brings into question what any foreigner is doing here. Visitors are inherently mobile, so the excuse for being in Beijing (there’s an i-j moment) at all needs to good and the reason for staying needs to be very good. Those with children (we aren’t going to get rid of the absorbed particles, so their risk is somehow greater) must be really quite concerned about action. Well, about actually taking the decision, since the evidence is pretty straightforward. Action, at all levels, public and private, collective and individual, is required.
DJS 20130209
1 soxious [new word from me, dated today, the 12th]; like noxious, but with sulphur.
2 I found a nice helpful site, bcairquality.ca and its associated site airhealthbc.ca, which grades AQHI as: A number from 1 to 10+ indicating the air quality. The higher the number, the greater the health risk associated with the air quality. When the amount of air pollution is very high, the number will be reported as 10+. I looked over British Columbia and found levels of 3 (Low Risk). I found concern for the Fraser Valley area, which has exceeded Air quality in the Fraser Valley at times exceeds the Canada-Wide Standard (CWS) for ozone (at Hope) and is close to exceeding the CWS for Particulate Matter. They just don’t say what those are !! Or at least on no adjacent site. In the reprint of this page I decided that this was a red herring. The Canadians didn’t help at all, because I couldn’t find a way that expressed their scale in the others’ terms. So the paragraph is down here, in the dross and extras, and my opinion of the site being ‘nice’ has changed.
The Canadian system probably counts like this table, taken from the Brits, does. I had to mess with the formatting to reproduce it, since tabs don’t work in iWeb or Sandvox and I haven’t found a viable way around that that keeps precision in formatting.
Table 2-1 Air Pollution Bandings and Index, and Accompanying Health Messages
Category Value Accompanying health messages for at-risk groups and the general population
Low 1-3 Enjoy your usual outdoor activities. Enjoy your usual outdoor activities.
Moderate 4-6 Adults and children with lung problems, and adults with heart problems who experience symptoms,
should consider reducing strenuous physical activity, particularly outdoors. The general population can enjoy your usual outdoor activities.
High 7-9 Adults and children with lung problems, and adults with heart problems, should reduce strenuous physical exertion,
particularly outdoors, and particularly if they experience symptoms. People with asthma may find they need to use their reliever inhaler more often. Older people should also reduce physical exertion. Anyone experiencing discomfort such as sore eyes, cough or sore throat should consider reducing activity, particularly outdoors.
Very High 10 Adults and children with lung problems, adults with heart problems, and older people, should avoid strenuous
physical activity. People with asthma may find they need to use their reliever inhaler more often. Reduce physical exertion, particularly outdoors, especially if you experience symptoms such as cough or sore throat.
*Adults and children with heart or lung problems are at greater risk of symptoms. Follow your doctor's usual advice about exercising and managing your condition. It is possible that very sensitive individuals may experience health effects even on Low air pollution days. Anyone experiencing symptoms should follow the guidance provided on the web page at http://uk-air.defra.gov.uk/air-pollution/daqi .
3 Not true. What the family’s graduate researchers say is that there is probably charge and counter-charge between universities that are exchanging information. There is no obvious charge at the time of ‘taking’ something to look at, but I don’t doubt that there are bean-counters looking to feather corporate nests. Being a net exporter of information should be a measure of status in academia, but if so, some obvious strategies for the low-caste places occur to me, not least ‘Publish and be damned’. If somebody catches you.
4 Well, yes it is a linear scale, in the sense that is made of straight lines, but it is not, in the sense that it is not one straight line. I drew the graph, but then I set it as homework, so some bright spark (or lazy swine, depending on viewpoint) will just send me a link to my own answer, won’t they?
5 PM2.5 Particulate matter: the results of the air quality assessment for PM2.5 for each zone are presented in Form 9c of the Questionnaire, and summarised in Table 4-4. This table includes the target value (25 μg/m³ to be achieved by 1st Jan 2010) the Stage 1 limit value (25 μg m-3 to be achieved by 1st Jan 2015) and the Stage 2 limit value (20 μg/m³ to be achieved by 1st Jan 2020). All three apply to the calendar year mean.
Natural contributions have been removed from PM2.5 exceedances listed in Table 4-4. Exceedance of limit values of PM2.5 due to natural events (1999/30/EC Article 5(4)) or natural contributions (2008/50/EC Article 20) are as follows:
The modelled exceedance [excess?] of the Stage 2 limit value in zone UK0002 (West Midlands) is removed by the subtraction of the natural contribution (sea salt).
The measured exceedances of the Stage 2 limit value in zone UK0001 (site: Marylebone Road, annual mean: 24 μg m-3) and zone UK0024 (site: Glasgow Kerbside, annual mean: 22 μg m-3) remain even if the natural contribution (sea salt) is subtracted.
Annual mean concentrations of PM2.5 were within the target value of 25 μg m-3 in all zones and agglomerations. Under the Air Quality Directive, Member States will be required to achieve a national exposure reduction target for PM2.5, over the period 2010 to 2020. This is based on the Average Exposure Indicator statistic. The Average Exposure Indicator (AEI) for the UK has been calculated as follows: the mean PM2.5 concentration at appropriate UK background urban sites only was calculated for three consecutive calendar years 2009, 2010 and 2011. The values obtained were as follows:
2009: 13 μg/m³
2010: 13 μg/m³
2011: 14 μg/m³
The mean of these three values (to the nearest integer) is 13 μg/m³ This is taken as the AEI for the reference year of 2010. The AEI for the reference year 2010 determines the National Exposure Reduction Target (NERT), to be achieved by 2020 (see Annex XIV of the Air Quality Directive). With a reference year AEI of 13 μg/m³ the Air Quality Directive sets an exposure reduction target of 15%. The detailed methodology and results of this calculation are presented in Defra’s technical report on UK air quality assessment48.
From BJAir:
Usage
The scale and thresholds are based on the U.S. EPA standards at airnow.gov [http://www.airnow.gov/index.cfm?action=pubs.aqguidepart implies that the scale below applies to particulate matter, the principal problem perhaps) in Beijing air quality.]
Good 0 - 50
Moderate 51-100
Unhealthy for Sensitive Groups 101-150 also ‘USG’
Unhealthy 151- 200
Very Unhealthy 201- 300
Hazardous >300
The data used by this application comes from the U.S. Embassy via Twitter feed - BeijingAir. The description at Twitter indicates that the data comes from a MetOne BAM 1020 particle monitor located in NE Chaoyang District. We sometimes see "missed" hours each day (from 1 to multiple days) where the data we retrieve is empty. This is normal...please be patient.
6 PMC = Plymouth & Mannamead College, which suffered having me as staff from 1993-2007. All the school uses the abbreviation, so does the city. How Plymouth would like to be a city: no cathedral.
Note that the explanation applies to PM10 when the fuss is now over PM2.5, which <big assumption> is presumed to be scaled in the same way.The Visible Earth site from NASA says the AQI peak was 775 and that PM2.5 peaked at 886 µg/m³. This is not the same number according to the scale I quoted, but they are about the right distance apart. A colleague quoted his phone widget while at work (which would be AQI) as 799 on the day, so that is not primary data (how not? answers, please).
Note that the Chinese state figure for the 12th was 232. Different scale? Different unit? SEPA, the Chinese state environment protection Agency, gives the daily API by quoting the highest of the scores for SOx, NOx, PM10, CO and O₃. So it doesn’t measure PM2.5 - unfair, it may measure it but it doesn’t publish it. It could be that 232 was the daily average, even that it was PM that was the top scorer. More likely, though that 232 was the PM10 score, not the PM2.5.
I moved Fig 7 of the science direct paper, which started off here, to Pollution, trying to make files sizes less uneven.
lots of editing described in 107 - chasing corrupt files DJS 20130212
…Doing lots of re-uploading in May 2016, I see essays 104, 106 and 177 cover the same topic, as both my understanding and the available information becomes better.
