
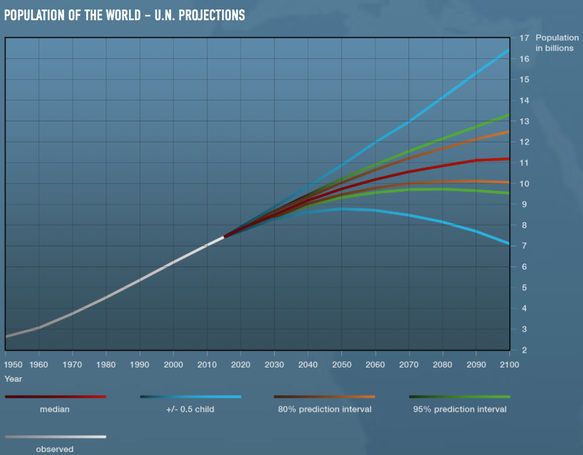
The image to the right is a UN projection for the planetary population of humans. We are increasing our numbers by about 80 million a year. Many forecasts point to this being an unsustainable number. We have several issues here: Is this growth acceptable? supportable? controllable?
Worse, as we run up against difficulties feeding these extra people, so we drive a steadily larger proportion into deprivation (meaning hunger and poverty) and probably into conflict and disease. So this might well have an element of brutal self-correction, some of which we have been seeing with the growing issues of world migration.
Yet this doesn’t have to be so: some studies show that increasing the education of women lowers the birth rate. It is a pity that this doesn’t correlate to the education of men and that on its own is food for thought (or reason to do away with men). ¹
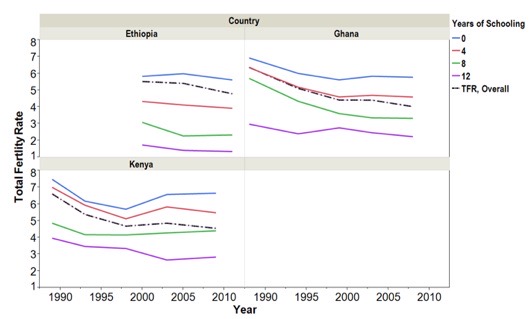
Diagram from an article from the World Economic Forum. A negative correlation is most clearly seen between different levels of female education and the total fertility rate (TFR) in a population. TFR is the number of children a woman can expect to have over her lifetime given current rates of age-specific fertility⁵. The first figure (right) shows TFR trends over time in Ethiopia, Ghana and Kenya among women with varying levels of educational attainment. What it shows for all three countries is that there are striking differences in TFR between women with no schooling and women with a high school education. In Ghana, women with a high school education have a TFR between 2 and 3, whereas those with no education have a TFR of about 6, even as recently as 2008. Similarly, women with a high school education in Ethiopia have a TFR of 1.3.
We clearly cannot, as a planet, support ever-increasing growth of humans. In which case there is an upper limit for a given level of resources. So we need fewer people, or more resources, or both. We absolutely need a lower rate of growth. If we do nothing, then the effects of crowding and perceived inequality will bring us soon enough to famine, migration and war – which may reduce the population and may indeed ‘fix’ the problem for a while. But is a planet-wide disaster a solution? To be even more crude, do we need WW3 to fix this problem? If so, I suggest it is humans that are failing, as a breed. Large-scale reductions of population by death will not cure the underlying expansion, it is more likely to generate increased growth and a repeated cycle of this, like the lemming.
Given the data that correlates education with a fall in fertility, ² is this causation? The evidence from sub-Saharan Africa clearly supports the causal role of female education in fertility decline. For example, an education reform in Kenya that increased the length of primary education by a year resulted in increased female educational attainment, and delayed marriage and fertility. One randomised control trial found that reducing the cost of school uniforms in Kenya not only reduced dropout rates, but also reduced teenage marriage and childbearing. Another study found that increasing female education by one year in Nigeria reduced early fertility by 0.26 births [per woman, presumably]. Let’s take a closer look at the causal link in Ethiopia, where 61% of women with no schooling have a child before turning 20 compared to 16% of women with 8 years of schooling. In 1994, the country did away with school fees, instituted school lunches in rural areas, increased the education budget and allowed local language classes. The 1986-born cohort of girls came of school age under the old system, while those born in 1987 were exposed to the reforms. The 1987-born cohort showed an increase in schooling of 0.8 years. [something missing?]
A forthcoming study (Pradhan and Canning 2013) of education and fertility in Ethiopia estimated that an additional year of schooling in Ethiopia would lead to a 7 percentage point reduction in the probability of teenage birth and a 6 percentage point decrease in the probability of marriage. These are large effects, suggesting that women with eight years of schooling would have a fertility rate 53 percentage points lower than those with no schooling at all, and are consistent with observed data.
I’ve written about a lot of this before: the thinking is that:
• educated women have a higher opportunity cost of child-bearing in terms of lost income
• educated women have more bargaining power
• educated women know more about health and so have greater confidence in their child’s survival.
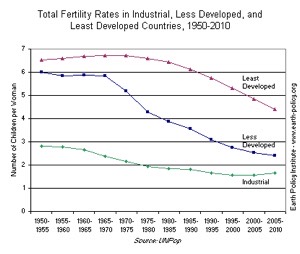
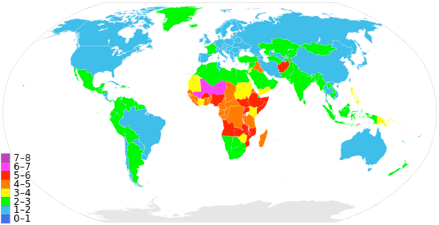
The Earth Policy Institute site gave me this graph, that gives an idea what population rates could be. I take it as a given that ‘least developed’ countries have high fertility rates. Since I’m saying fertility rates are the problem, then decreasing those in places where they are highest is a priority. Target has to be to slow the fertility rate down, preferably to something around or below replacement rate. ⁴ For context, the UK is at 1.9 births per woman, Guinea (either of them) is over 5, the Sudan and Eritrea over 4.
Actually, without being able to recognise which populations fall into which category, this is both pretty useless and uselessly pretty, as a graph. What proportions of the population fall under which label?
Where war is, what happens to education? Is that an objective, to reduce the masses? How does that in any way fall in line with the first world attitude that says raising the education standard improves the whole nation?
It is hard to show any correlation for this, for any country at war is not going to have much interest in producing figures of this sort, but have a look at Primary School Enrollment and Total Fertility Rates, Latest Year (2000-2010) from the table here. The last time Syria gave figures, primary school enrolment was 95% and Total Fertility Rate 3.2. Zambia has 91% and 5.8; Vietnam now at 94% and 2.1; China is recorded as 93.5% and 1.0. At the time of writing there are wars in CAR, DRC, Egypt, Libya, Mozambique, Nigeria, Somalia and both Sudans. I give the paired primary attendance and TFR for these countries in blue. To improve this, we need the figures across a period wider than the war itself; I would expect a war to increase fertility both at the time and afterward.
Country Primary Att TFR
Nigeria 61.4 5.7
Mozambique 82.3 5.1
Cent Af Rep 66.7 4.8
DRCongo 58.9 4.4
Sudan 39.2 4.2
Syria 94.5 3.2
Egypt, 93.6 2.9
Somalia, Libya and South Sudan had no figures available
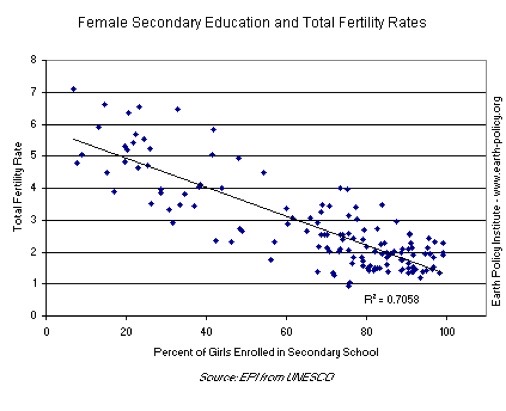
The EPI paper highlights that it is secondary school (i.e. continuing education) that is especially of interest, as seen in this graph: Stats exercise; find the correlation coefficient and comment on it. ⁶
That paper continues:
Worldwide, 69 million elementary-school-aged children were not in school in 2008, 37 million fewer than in 1999. By 2005, almost two thirds of developing countries had achieved gender parity in elementary school enrolment. Still, a majority of children not in school are female, and early marriage and motherhood keep many of the world’s poorest girls from completing secondary school. ³
Which says, I think, that we need to change some attitudes globally and urgently so that these girls stay at school and out of motherhood. And, one hopes, that with more education, these same people are less poor. Thus ideally we move more countries from the top red graph line above to the blue one.
Global fertility is around 2.5. It needs to be around 2.14, though I’d prefer 2.0 and have the total slowly reduce.
The world population history site includes this paragraph: In trying to project how fertility rates might change in future years, we need to understand what could be behind those changes. A number of factors can affect how many children people choose to have, including economics, cultural norms and traditions, education, public and reproductive healthcare. Demographers analyze trends in these areas to determine how they might affect fertility. For example, with improved healthcare, infant mortality rates decline, and as a result of more children living on to their adolescent years, families are less likely to have additional children. Another factor influencing fertility rate is girls’ education. The higher the percentage of women within a country who have obtained at least a high school level of education, the lower the fertility rate. Because these and other factors (e.g. income, gender equity, traditions/cultures, health education, contraceptive use, personal and national security) have been linked to fertility trends, demographers track this information within countries to project what the future may hold.
I pointed out in the articles on immigration that newcomers to a country tend to have more children than the average, where the reasoning is perceived to be that they feel safe and are still applying the thinking they held five years earlier. They have a number of children that they feel ‘right’ about, which follows the ‘old country’ habit, for that country’s reasons. In the same way, people from large families tend to have large families; there is a strong correlation between the number of siblings one has and your own number of children. As the wikipedia article says: Factors generally associated with increased fertility include religiosity,[27] intention to have children,[28] and maternal support.[29] Factors generally associated with decreased fertility include wealth, education,[30] female labour participation,[31] urban residence,[32] intelligence, widespread birth control usage, increased female age and (to a lesser degree) increased male age. Many of these factors however are not universal, ⁷ and differ by region and social class.
DJS 20160929
http://www.earth-policy.org/data_highlights/2011/highlights13
https://www.weforum.org/agenda/2015/11/the-relationship-between-womens-education-and-fertility/
http://worldpopulationhistory.org/womens-status-and-fertility-rates/
https://en.wikipedia.org/wiki/Total_fertility_rate
Top pic is a graph from here, more recent than the 2011 article used, copied as a screen shot.
1 For those who like the idea of war somewhere else being a factor reducing the populations (“I don’t care, it doesn’t affect me”), do you then prefer the idea of ONLY men waging war or liking the idea of all genders participating in war? Is it man that is the problem and, if you are a man, what part of you is the problem? Indeed, is it our male biology that is the problem?
2 For the totally self-centred male, a reduced fertility rate does not mean you get less sex; nor does it mean your sperm are ineffective (though that might be a cure). It means there are fewer babies born. Fewer, not less. You don’t want less baby, but that’s on the cards too.
3 The EPI site says: Although fertility falls when both male and female levels of education rise together, there is a large gap between male and female secondary school enrolment in sub-Saharan Africa (see figure below). Achieving gender parity in educational attainment could thus have a substantial effect on fertility rates.
4 Replacement rate is a fertility of two children per women, though if death rates are high, this is not so. Some developing countries have made progress in reducing fertility, but fertility rates in the least developed countries as a group remain above 4 children per woman. (EPO)
5 TFR, as Wikipedia explains and I did in an earlier essay, ia a measure of the fertility of an imaginary woman who passes through her reproductive life subject to all the age-specific fertility rates for ages 15–49 that were recorded for a given population in a given year. The TFR represents the average number of children a woman would potentially have, were she to fast-forward through all her childbearing years in a single year, under all the age-specific fertility rates for that year. In other words, this rate is the number of children a woman would have if she was subject to prevailing fertility rates at all ages from a single given year, and survives throughout all her childbearing years.
It is a good index because it is independent of the population age structure.
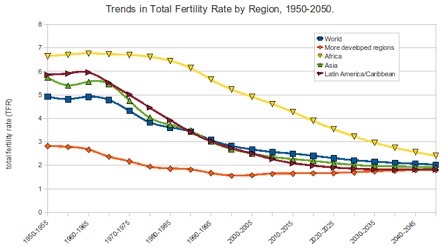
This second graph separates out Asia, Africa, and Latin America. the trouble is that, while the whole is trending in the right direction, it needs to come down to the red line before we cease to stare disaster in the face. I point out that China’s included figure is a birth rate of 1.0, when within that country there is a fairly strong feeling that there is significant error. If that were a typical error value across 75% of the planet, we’d have an error in these figures roughly equal to the population of India, around the billion mark. I wonder how the UN tests or checks its figures.
6 A different graph gives log TFR against log GDP, with correlation line drawn and the coefficient (pmcc) is 0.78. Pretty significant. Does that suggest that GDP goes up if TFR goes down or that TFR goes down if GDP goes up? Surely the first of these makes more sense.
7 and it continues: For instance, at a global level, religion is correlated with increased fertility, but in the West less so: Scandinavian countries and France are among the least religious in the EU, but have the highest TFR, while the opposite is true about Portugal, Greece, Cyprus, Poland and Spain. Go figure.

_vs_log(GDP).png)