
There are too many people on the planet. We have competition for scarce resources, burgeoning population and no widely agreed solutions. There are significant trends and motivations against dealing with such things; picking two more or less at random, how about religion¹ and pension funds²?
Let us, for the purposes of this page, forget about how we feel about unwanted migration and look instead at the pressures on those who feel the need to migrate. We see, looking at migration in the immediate past and present, that a principal cause is war. War is usually about control of people and resources, including land (but not water, I discovered back in essay 114). More generally, migration occurs because people are seeking a better life and we often use the term refugee to describe the evasion of destructive persecution in some form, usually labelled race, colour and creed. I’ve put a list of terms in a box lower down the page.
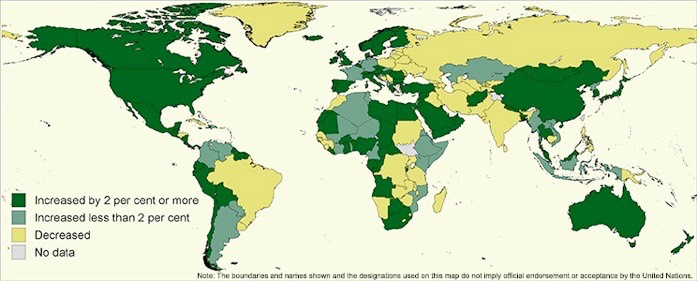
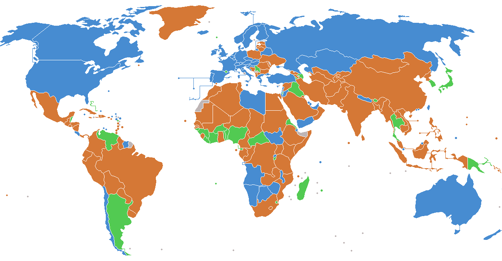
This diagram is from here and shows average annual rate of change of international migrants, 2000-13. Contrast that with the top picture, taken from wikipedia showing net migration in 2011. The link will give you the data.
Trends in global migration:
1990 154 million,
2000 175 million, 1.2% growth per annum since 1990, 2.9% of the global population
2013 232 million 2.2% growth p.a. since 2000, 3.2% of the global population, so it is an accelerating problem.
Half of all the migration occurring is directed at ten countries, in this order: the US, Russia, Germany, Saudi Arabia, UAE, UK, France, Canada, Australia, Spain. Expressing that differently for units of similar area, Asia took a shade more than Europe, who took a similar amount to the US, Canada and Australia combined. The Russian figure is made complicated by the breakup of the larger federation and much of what is now recorded would previously have been labelled as internal movement.
I mostly failed to copy diagrams from the UN outlet, so you’ll have to read the .pdfs for yourself.
Vocabulary:
A migrant is someone not living in their country of origin. This begs better definition, especially for counting purposes.⁵
A migrant is someone who moves (changes country), presumably to seek better work and/or living conditions.
An economic migrant seeks to improve their standard of living. These migrants can move via legal or illegal channels.
A refugee is someone who leaves their country to avoid war, persecution or natural disaster. Refugee can also be used to refer to someone granted asylum; this second meaning is precise, which goes a long way to explaining why the topic is misunderstood, becasue the looser meaning is often heard. Refugees constitute around 7% of migrants, on 2013 figures. Migrants generally move from developing countries to developed countries, described as moving from North to South even if geographically inaccurate³. The UN Population division⁶ tells us that the numbers of migrants moving to Asia and to Europe are similar, around 70 million.
An asylum seeker is a refugee with a well-founded fear of persecution (particularly death) if returned to their home nation. see expanded explanation. Bear in mind that 75% of asylum seekers are refused asylum. Also note that an asylum seeker has ceased to be under the protection of their home nation. An asylum seeker cannot be an illegal, nor can it be ‘bogus’. A refugee refused asylum is no longer a refugee (is denied as such) and is required to leave the UK. The UK provides support for such folk.
Fertility rate means not the ability to have children but actually having them, the mean number of children born to any woman.
The birth rate is the number of live births per 1000 population per year.
The demographic dividend occurs when fertility and mortality rates fall, causing fewer dependants and a larger workforce, freeing these and other resources for economic development and hence greater spending on health and education, cycling back into economic growth. The UN tells us that four key actions are (quoting):
• increase investment in young people’s human capital
• increase opportunities for employment
• expand access to contraception
• improve access to financial systems
This dividend occurs especially noticeably when the working 15–64 sector of the population exceeds the non-working sector, but most so when the necessary structures and policies are in place. The cycle as described typically occurs when supply of water and sanitation produces fewer child deaths and so a larger cohort of children. Resources within each family are diverted to the children, reducing economic growth. Oddly, when child survival improves, parents are happier contemplating smaller families, reducing fertility rate and bringing about the so-called dividend. It is this indirect connection I find weak, as it relies upon the state intervening to point out the possibility of having a smaller family and the consequent economic boom. Once going, the economic boom draws women into work and out of childcare, further lowering the fertility. The critical moment is when the labour force grows faster than the dependent and dependant population, which is when resources at both the industrial and household level are freed for investment. For chapter and verse, see the UN paper and its academic footnotes. I put an example of dependency ratios down by my signature block. Further research shows that eventually (50 years, two generations later) the lower fertility and improved health care mean there is an ageing (and rapidly non-productive) cohort within the population, dragging the dividend back to place a nation’s economy in a different and lower but stable state. What we see in Europe is these (older) countries then finding uses for migrant populations. What we need to see is those migrants returning to change their home countries sooner.
% changes in the 15–64 population between
2015 and 2050, (UN, 2013)
Least developed countries 113%
Other developing countries 22%
Sub-Saharan Africa 145%
Latin America and the Caribbean 20%
Asia 10%
Historical evidence of this can be seen in East Asia, where, between 1965 and 1995 annual income per capita (China, HongKong, Korea, Japan, Singapore) jumped by a factor of four, a third of which can be attributed to economic dividend. East Asia has (2014 figures) 2.4 workers for every non-worker (this must be an index with a name, not yet discovered by me). Contrast this with the sub-saharan area (south of the desert, which equates to excluding all African countries with southern mediterranean coastline. You probably ought to add Sudan and in my own view the second line of countries as you advance south should be excluded.
We also see that unwanted births are most common among the poor and a sorry correlation between income and education, the less direct one between your parents’ or grand-parents’ income and your education level.
DJS 20150804
See also the essay ‘Population issues’ (currently numbered 208) of 20160929.
Top picture from wikipedia showing net migration rates in 2011.
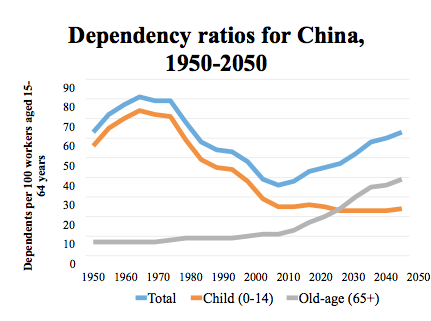
Slide on dependency ratios from Tim Dyson, LSE, speaking at the UN 13/4/2015
Of course if we were sensible we would cover the Sahara with solar cells and turn relatively useless space to profitable use. The area need to meet current power needs is amazingly small.⁴
Websites used or visited or both, to treat as wider reading;
http://www.unfpa.org/resources/state-world-population-2014-resources-kit
http://www.unfpa.org/news/10-things-you-didn’t-know-about-world’s-population# 10 Oh yes I did.
http://esa.un.org/unmigration/documents/The_number_of_international_migrants.pdf
http://www.unhcr.org/pages/49c3646c4d6.html UNHCR provides data on refugee movements, numbers and so on.
http://landartgenerator.org/blagi/archives/127 Discusses sufficient solar power generation.
http://www.migrationwatchuk.org/briefingPaper/document/70
https://www.churchofengland.org/media-centre/news/2005/03/pr2905.aspx A Place of Refuge, Bishop of Southwark, 2005
http://migrationobservatory.ox.ac.uk/briefings/who-counts-migrant-definitions-and-their-consequences.
10 Oh yes I did. The author clearly has an agenda, when I wish to find unbiased reporting. On one hand we presumably disapprove of suffering and for some reason I don’t get, mother/child suffering is worse than others (perhaps an implication that men are not responsible for pregnancy?). On the other hand, all this suffering helps reduce the global population. One is repeatedly struck by the inability to see what the problem is (I say it is simply too many people, an infestation of humans).
1. There are more young people in the world than ever before,
2. Women in sub-Saharan Africa are as likely to die in pregnancy or childbirth as women in nineteenth-century England.
3. A staggering 225 million women in developing countries want to avoid pregnancy but are not using modern contraceptives.
4. Despite prohibitions, child marriage remains widespread around the world. About 37,000 child marriages take place each day.
5. Complications in pregnancy and childbirth are the second leading killer of adolescent girls in developing countries.
6. By the end of the century, 2100, the world’s population might be as high as 17 billion or as low as 7 billion, according to the most recent UN estimates.
7. HIV-related deaths are down 35 per cent from 2005 – but estimates suggest that deaths among adolescents are actually rising.
8. If current trends continue, an estimated 15 million girls between ages 15 and 19 will be subjected to female genital mutilation (FGM) between now and 2030.
9. There are more people migrating than ever before. In 2013, some 232 million people were international migrants, up from 175 million in 2000.
10. More than half of the global population is urban – and history’s largest-ever urbanisation wave will continue for many years to come.
1 Point made in Essay 174. Any religion advocating a smaller population is spreading the word first among its own membership. All nearby religions (in any sense) would seem likely to profit from disagreeing, however silently. Religions continue to say “Go forth and multiply”. Competition between religion depends on numbers of the faithful.
I still wish to meet a proselytising atheist.
2 A pension fund is supposed to hold your contributions in a fund (‘yours’) so as to pay from this fund at some future time. In practice, you will be paid out of current contributions and the fund is a conglomerated pile of all contributors. That (set of lies) plan relies upon there being more people contributing than collecting, or at least more contributions than pay-out. This will not work in a decreasing population. Stop the initial lie, fix the problem. Alternatively, manage your own pension fund.
3 The term “North” refers to countries or regions traditionally classified for statistical purposes as “developed,” while the term “South” refers to those classified as “developing.” The developed regions include Europe and Northern America plus Australia, New Zealand and Japan. These terms are used for statistical convenience and do not express a judgment about the stage reached by a particular country or area in the development process.
4 data from here, with unit conversion and rewriting. World energy consumption will be around 700 exajoules [7x10²⁰J] in about 2025. This is around 2x10¹⁴ kWh. Assume each square metre of photovoltaic cell is 15% efficient (they are already), has 250 days of sunshine (probably more, but allow for losses, breakage, etc) and say 8 hours of usable sunlight when it’s probably nearer 12; that’s 2000 hours of usable sunshine per year. Sunshine (solar flux) is around 1kW/m2. So multiplying all these together we have 300kWh per square metre, which means we need 6.7x10¹¹ sq metres, 670,000 km² of solar cells. At a 90% efficiency distribution (you need space to service the things, most of which would go in the shade; you need a significant distribution system and you’d have to allow for losses en route, but we’re still talking about a square of around 1000km on a side. The Sahara is nine million km², around ten times bigger than we need. Chip away at my very conservative numbers and we might need only half as much. Install a great deal of solar cells locally in developed countries and the demand falls rapidly, but in turn it still turns any useless space into a profitable venture. Turn it around and try the sums if we put all the Sahara under solar cells and you get 50 times the current global consumption at any moment. So why don’t we do something? Emails please. The site I referred to indicates that just covering all golf courses would give us 10% of what we need globally, ignoring infrastructure demands. Your share of the demand is a 9x9m square. These figures are based on technology now with no further improvement, where we might reasonably expect a fivefold reduction in the next ten years. My own domestic roof has 40 m² and we don’t use the garden, a similar area. So I can see my share being easily completed, but I’d be happy to fund it elsewhere (too, not instead).
5 http://migrationobservatory.ox.ac.uk/briefings/who-counts-migrant-definitions-and-their-consequences. Particularly, when is a migrant no longer classed as such? One such distinction in the UK is the test of right to abode. This is not opposite to ‘those subject to immigration control’, i.e. people who need permission to be or stay within the UK, mostly because EU nationals in 2015 have a right to be in the UK if they wish. One useable definition of migrant is simply ‘foreign-born’, which then includes those granted UK passports, and so not migrants defined by nationality or immigration control. Foreign national is the term used by National Insurance data, but this is confused when self-reported, 'nationality' may be interpreted as describing an elective affinity dependent on social and cultural factors and personal feelings, rather than legal status. Slightly more useful is long-term international migrant, LTIM, someone who changes
country (of usual residence) for at least a year; this is the UN definition and is used by the Office of National Statistics (ONS UK), but the downside is that it is largely self-reported. Is my wife a long-term migrant? Well, she thinks so, and would report herself as such, but she has just been here a whole year, so maybe she is only very recently classed as such—in which case, what was the label before that, long-term visitor?.
Definitions of migrant as represented in government data sources is a well-presented table I cannot (see how to) copy. Beware people using terms interchangeably when they should not: a foreign-born resident can be different from a foreign national; not all foreign-born UK residents are subject to immigration control, e.g. children of service personnel, people given citizenship. EU (really, EEA) nationals are often in debate considered ‘migrants’ but are exempt from immigration control and this applies to EU nationals born outside the EU, too. Last, ‘migrant’ may or may not include asylum seekers. When used the wrong way (especially when using the large label ‘migrant’ but meaning the far smaller group ‘asylum seeker’) this is very destructive.
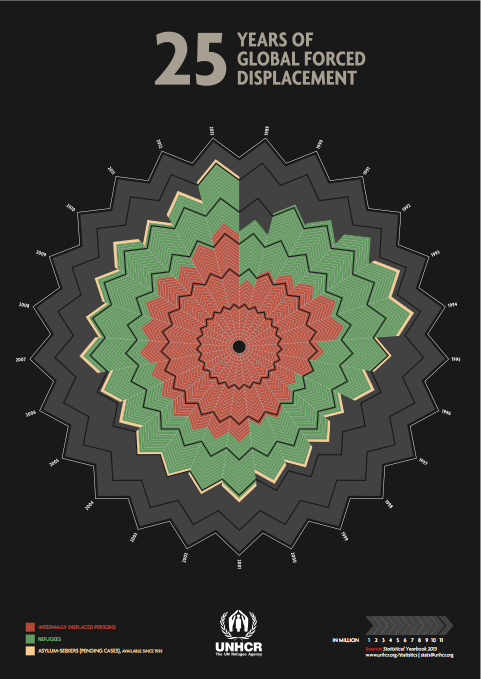
Diagram from UN source. http://www.unhcr.org/54d0e28d9.html While the diagram is self-explanatory, it begs detail explaining the reasons for all the jumps in brown (internally displaced persons) and green (refugees) of 1993/4, 2001, 2011, 2013. I later wondered what the grey is supposed to represent, but maybe it’s just space up to sixty million people.
6 If you want data from the UN Pop Div it can be done, and I suggest you start here, [http://www.un.org/en/development/desa/population/migration/data/estimates2/estimatestotal.shtml] then moving top select from the download options at the foot of the page.
