

We are complaining at the numbers of people seeking to enter Britain by forcing access to lorries at Calais. This is part of a wider malaise that I will research. I start here by looking at changes in UK population. We have several issues here: none of us want illegal immigration; at a local level I’m not going to give house room to a stranger (I recognise this is an uncharitable personal failing); we do not want the population in Britain to rise—it is already too large, we haven’t the space in England and we’re running out of facilities and resources.
Yet the number of people wishing to move and doing something about changing countries is large, at 232 million in 2013. And rising. That figure is further confused by events such as the break-up of the USSR, which added 27 million to the ‘international migrant stock’. Confusing, because the count then includes the movement between what had been constituent parts of the USSR. Trying to simplify the task, I reduced the scope of my search to just the UK and found a report from the ONS [Office of National Statistics] May 2015, summarised by me: ¹
Looking at proportions of the 641,000 UK intake, we have EU at 42%, non-EU at 45%, British passport holders at 13%. The asylum seekers lie within the non-EU figure at 4%, a small proportion of the intake. Leaving, we have 323,000, of whom 28% were EU, 29% non-EU, 43% British. The changes, the ones the ONS calls statistically significant, were increases in both EU and non-EU intake. Numbers of people moving here to do study stayed the same (30% of the intake), as did exit numbers. Those joining family rose to 14%. ⁵
Immigration to the UK by citizenship, 2005 to 2014 (year ending December 2014). ONS May 2015
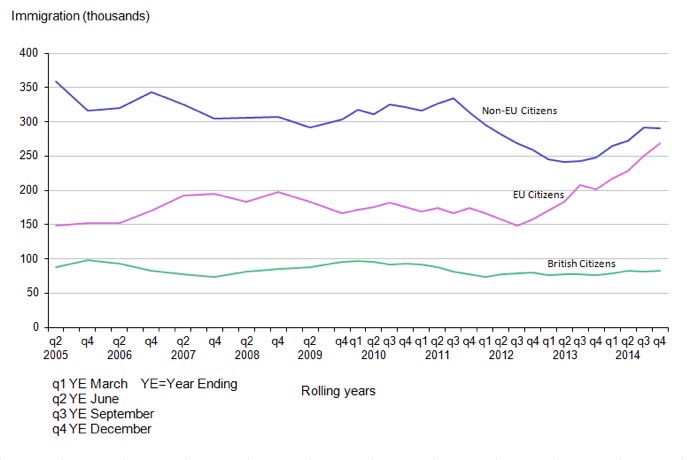
Movement of EU people has stable exit figures but increasing intake figures. Note that the number of migrating ‘New Commonwealth’ citizens is steadily falling.
Long-term international migration of EU citizens, UK, 1975 – 2013 [ONS.gov.uk May 2014]
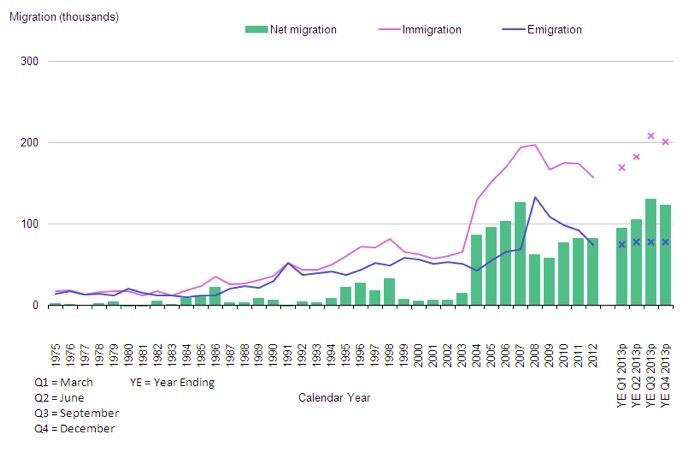
Observe the significant leap as EU members, especially new members, seize the opportunity to work here, and then move the opposite way in 2007. Points-based immigration for those outside the EEA began in 2008 – I don’t say that’s an explanation of one for the other.
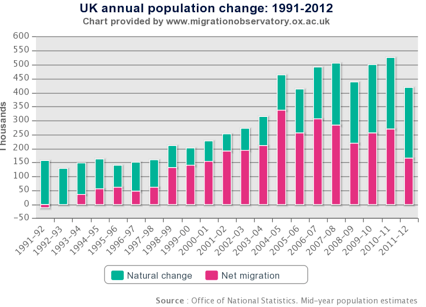
The Oxford study I have linked separates the natural change from that added by previous migration. My reading of that says the birth rate rises to 3.4 per 1000, but it is explained that the total (zero-growth) would decline past 2050. We must recognise the perpetuation of growth caused by the consequences of immigration (that they have more babies than the host population, partly because the migrants tend to be of parent age). But the models then say that the increase in population due to net migration will grow by more than the natural growth, that is that steadily the proportion of change will be mainly migration. We’re at 51% now and we can expect 60%. Look at the figures for yourself, since the researchers are updating the projections all the time; as the population is changed by the influx, so the prediction changes.
From an Oxford study, I found that
• More than half (54%) of the increase of the UK population between 1991 and 2012 was due to the direct contribution of net migration.
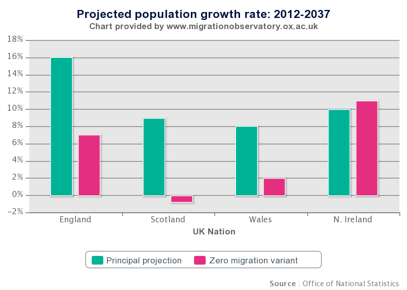
• Differences in net migration assumptions, between the ‘low’ and the ‘high’ variant projections, produce a range of variation of 3.3 million in the projected size of the UK population in 2037 (between 71.6 and 75.0 million).
• In the principal projection, the cumulative net inflow of post-2012 migrants accounts for 43% of total population growth until 2037. A further 17% of projected population growth is attributable to the additional contribution of new migrants to natural change (i.e. births and deaths).
• The projected contribution of net migration to population change considerably differs across the four UK constituent nations. Without net immigration Scotland’s population would stagnate over the next two decades and decrease in the longer term.
• Net migration assumptions have been continually revised in the projections released since the mid-1990s, reflecting rising levels of net migration and the high uncertainty of migration forecasting. The reduction in assumed net migration levels in the latest projections (relative to the previous 2010-based release) does not result in significant slowdown of future population growth because of the concurrent projected increase of fertility and life expectancy.
Other snippets, , on 2012 or 2013 data,
.• The UK refused 3% of 2013 applications for citizenship.
.• The median EU population age was 42 years at the end of 2012, but those EU migrating to Britain were aged 26 at median and to Bulgaria aged 40. 2/3 of EU migrants to Cyprus were women.
.• 4.1% of the EU population holds citizenship outside the EU. 13.7 million (about 2.7%) lived in an EU (EU27) state not of their birth. In five cases (Ireland, Hungary, Luxembourg, Slovakia and Cyprus) the number of persons born in other EU-27 Member States was higher than the number born outside of the EU-27 (in other words in non-member countries).
.• People born abroad outnumbered foreign citizens in all of the EU-27 Member States, except Latvia, the Czech Republic and Luxembourg.
.• 97% of those acquiring citizenship in Hungary were Romanian.
.• 53800 Turks moved into Europe and changed citizenship in 2012. 62% went to Germany.
.• 59300 Moroccans moved into Europe and changed citizenship in 2012. France took 28%, Italy 25% and Spain 16%.
I got myself side-tracked by the leap in ‘natural change’ and then realised that if the two parts were reversed, red on top of green, the natural change (zero net migration) would show a steady increase. (If I am right, then the red and green would be better if swapped.) However, much of that growth in green is from previous migration; births to foreign-born women made up 25.5% of all births in 2011, up from 16.4% one decade earlier (2001). Read the study yourself; the foreign-born woman has a different background and a higher fertility than those here. This is mostly cultural but implies that new immigrant families will continue to grow more than non-immigrant families. They’re all British, of course, but in a sense we see that this Britishness is a slowly-acquired characteristic.
This means in turn that zero-migration models have a flattening curve, as the growth rate would be expected to slow. Even so, on zero migration we will grow from 64 million in 2013 to 67 million in 2030, 3 extra births per 1000 people every year. Migration changes that position radically and it is likely we will pass 70 million by 2030, with 72 million by then quite possible if we cannot find ways to change the situation. So we’re looking at 3-5 million people, genuine legal migrants, adding themselves to the population, doubling our growth rate. This is a whole quarter million people every year. The most recent figures (which may prove a temporary blip if politically we get a grip on this) show migration exceeds natural growth. Therein lies a problem.
That growth problem generates other problems. The growth is almost entirely in England; Scotland has an expected shrinkage, independence aside. Our projected new housing needs to meet growth (doubling the expectation helps not at all); infrastructure change is extremely slow in Britain (typically ten years from inception to build) so we’re always behind, always too crowded, underfunded and not communicating the bigger picture.
So is any of this a temporary situation? Well, we as Brits might add to the steady exodus. Steady, meaning the numbers don’t change much. We could go live elsewhere and free up space here. We could go live in Europe to balance those Europeans working here. We should expect that movement to vary, but if we look at US models of migration, change is slow. That is because it is perception that needs to change. We have the principle of free movement in Europe. Changing that fundamental is not an option unless we leave the Union. However, modifying the ability to move, and more particularly its perception, may well be within our power. If you are a Brit wishing to stay in Britain, join the move to chilly Scotland or to wet Wales and accept the consequent changes. ³
DJS 20150705
Essay 91 predates this. Post the 2016 referendum (Brexit) we only know that the situation will change. I seriously doubt there will be any reduction, and probably a short-term rise in migration, both in and out..
Remnants below that I may well come back to, but didn’t in the two weeks subsequent to first writing. You might encourage me with some questions. There’s a lot of additional information in the stuff, mostly footnotes, below. I’m writing what I want to read in the newspaper but struggling to reach the standard I’d like to be reading. Mostly I end up needing (i) the clarity one might get from bouncing ideas off others and (ii) access to better information, particularly the academic works I can’t access from home without spending silly money.
1) I wondered whether UK growth is different from European growth, in that it might be lower. The EU population increases each time another country joins. Adjusting for that, then as you would expect the natural growth varies across the Union. Figures for 2012 say that natural growth (births less deaths) added 0.22 million, while net migration added four times as much, 0.9 million. Desirable or not, this is normal for Europe since 1992. Natural increase in 2012 varied form 9.5% in Ireland to -5.5% in Bulgaria. Net migration also varies; 19% Luxembourg, ⁶ Italy 6%, Ireland & Lithuania -7%. See. See 2014. Net gain for the EU was 1.7 million immigrants and a very similar number changed states within Europe. ⁷
2) Illegal immigration is a problem. http://news.bbc.co.uk/1/hi/uk_politics/4989874.stm There are many problems with counting this – we know only those we catch and the rest is guesswork. The figures are of detected flow so apparent changes can be exaggerated by a completely unknown success rate. One may be finding 5% or 25% of the immigrants; reaction to an identified change may catch more or fewer of the total. [See this 2011 study]. One can measure the effort but then guess that all efforts are equally effective. Difficult is not a strong enough term and elusive makes it sound more like a game.
The 2013 report shows that of the 210,000 study visas granted, 62,500 were given to Chinese, where the next biggest national group was the USA on 14,000, then India, Nigeria, Malaysia and HongKong (not within China on this count). 15% of those given student visas in 2007 were still here in 2013; this is a marked drop from 23% in the 2004 cohort.
Looking at family migration (especially non-EU migrants joining those already here) 2013 had 33,700 against 40,900 in 2012, the fall being mostly partners. A typical figure for long-term immigration of non-EU people is 40,000. The long-term trend is downwards. Of these the national distribution is Pakistan (12%), India (10%), United States ⁵ (6%), Nepal (5%) and Philippines (4%).
Settlement has gone up 34% to 60,000, mostly [84%] spouses.
Visitor visas for 2013 were just under two million, 14% up on 2012. Much of the increase was accounted for by higher numbers issued to Chinese (+39%), Russian (+21%), Kuwaiti (+42%), Indian (+6%) and Saudi Arabian (+20%) nationals.
URLs used:
http://www.migrationpolicy.org/programs/data-hub/international-migration-statistics
http://www.un.org/en/development/desa/population/migration/publications/wallchart/index.shtml
http://migrationobservatory.ox.ac.uk/briefings/impact-migration-uk-population-growth ‘The Oxford Study’
http://www.migrationwatchuk.org/latest-immigration-statistics
http://www.e-ir.info/2013/12/14/the-challenge-of-illegal-immigration-in-europe/
Of the 111.1 million journeys to the UK in 2013, 88% were Brits, EU nationals and EEA/Swiss nationals. 138,000 Brits left and 79,000 returned. In 2014’s figures, 209,000 other EU nationals came in and only 78,000 left. Here are the 2014 figures:
UK 2014 All Citizenships British Non-British EU Non-EU Migration figures for UK, 2014
Immigration 641,000 83,000 558,000 268,000 290,000 net gain 318,000
Emigration 323,000 139,000 184,000 91,000 94,000 2013 figure 202,000
Net Migration 318,000 -56,000 374,000 178,000 197,000
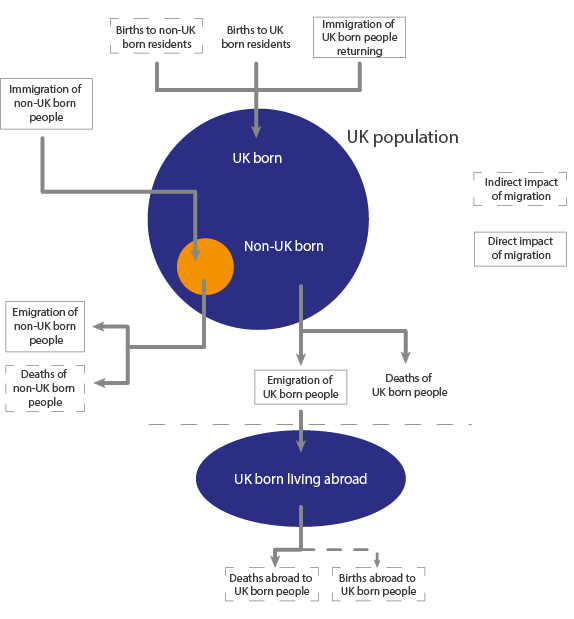
Here’s an excellent diagram from the ONS where the link takes you to a good overview of how migration affects the population.
• Net long-term migration to the UK (immigration less emigration) was estimated to be 318,000 in the calendar year 2014. This was just below the previous peak (320,000 in the year ending (YE) June 2005) and a statistically significant increase from 209,000 in 2013..• 641,000 people immigrated to the UK in 2014, a statistically significant increase from 526,000 in 2013. There were statistically significant increases for immigration of EU (non-British) citizens (up 67,000 to 268,000) and non-EU citizens (up 42,000 to 290,000). Immigration of British citizens increased by 7,000 to 83,000, but this was not statistically significant.
.• An estimated 323,000 people emigrated from the UK in 2014. Overall emigration levels have been relatively stable since 2010.
.•284,000 people immigrated for work in 2014, a statistically significant increase of 70,000 compared with 2013, continuing the rise since the middle of 2012. There were statistically significant increases compared with the previous year for both EU (non-British) non-EU citizens, whereas the increase for British citizens was not statistically significant.
.• Latest employment statistics show estimated employment of EU nationals (excluding British) living in the UK was 283,000 higher in January to March 2015 compared with a year earlier and non-EU nationals in employment increased by 11,000. Over the same period, British nationals in employment also increased (by 279,000).
.• In 2014, work-related visas granted (main applicants) rose 11,007 (or 10%) to 119,883, including a 6,842 (15%) increase for skilled work.
.• National Insurance number (NINo) registrations to adult overseas nationals increased by 221,000 (37%) to 824,000 in the YE March 2015, when compared with the previous year.
.• Immigration for study increased from 177,000 to 193,000 in 2014, but this change was not statistically significant. Over the same period visa applications to study at a UK university (main applicants) rose by 0.3% to 168,562.
.• The number of immigrants arriving to accompany or join others showed a statistically significant increase, from 71,000 to 91,000 in 2014.
.• 46,000 Romanian and Bulgarian (EU2) citizens immigrated to the UK in 2014, a statistically significant increase from 23,000 in the previous 12 months. Of these, 35,000 were coming for work, a statistically significant increase of 19,000 compared with 2013. The latest estimates reflect the first full year since EU2 working restrictions ended on 1 January 2014.
. •There were 25,020 asylum applications (main applicants) in the YE March 2015, an increase of 5% compared with the previous 12 months (23,803). The number of applications remains low relative to the peak number of applications in 2002 (84,132). The largest number of applications for asylum came from nationals of Eritrea (3,552), followed by Pakistan (2,421) and Syria (2,222).
2 ONS uses the terms EUnn, (e.g. EU15] to categorise EU member states. This relates to the sliding scale of rights as nations join the Union.
EU 27 The European Union comprises the 27 members in 2008: Croatia [2013 completion] is #28. The EEA adds Iceland, Liechtenstein and Norway. Switzerland is a member of the single market but not the EU or the EEA (European Economic Area).
EU15 means member countries in the European Union prior to the accession of ten candidate countries on 1 May 2004. The 15 countries are: Austria, Belgium, Denmark, Finland, France, Germany, Greece, Ireland, Italy, Luxembourg, Netherlands, Portugal, Spain, Sweden, United Kingdom.
EU 8 means those added in 2004—Malta, Cyprus, Estonia, Latvia, Lithuania, Poland, Czech Republic, Slovakia, Slovenia, Hungary. That’s ten countries, not eight.
EU2 means Romania and Bulgaria, added in 2007
EU21: All EU countries prior to the accession of the 10 candidate countries on 1 May 2004, plus the four eastern European member countries of the OECD, namely Czech Republic, Hungary, Poland, Slovak Republic
The references make sense when you review the order in which nations joined the EU:
1958 [‘the Inner Six’] Belgium, Germany, France, Italy, Luxembourg, the Netherlands;
1973 [to 9] Denmark, Ireland, the UK; 1981 [10] Greece; 1986 Portugal, Spain [to 12]
1995 [12-15] Austria, Finland, Sweden;
2004 [15 -25] Cyprus, Czech Republic, Estonia, Hungary, Latvia, Lithuania, Malta, Poland, Slovakia, Slovenia; 2007[ 25-27] Bulgaria, Romania; 2013 [28] Croatia.
Future additions, in application order: Turkey 1987, Macedonia 2004, Montenegro 2008, Albania 2009, Serbia 2009. Remaining Balkan nations (e.g. Bosnia) are working on the matter. Of the post-Soviet neighbours (a delightful wikipedia phrase) the EU itself notes that Armenia, Azerbaijan, Belarus, Georgia, Moldova and Ukraine could become EU members. Read the link.
3 English growth 16% across 25 years, Scotland’s 9%, Wales 8%, N Ireland 10%. You can see an effect of Irish problems.
4 Asylum figures can be found in the many reports from uk.gov, such as this one. Things I noticed were that the total is way down from a 2002 peak over 80,000 and is settled at a little over 20,000. A confusion here is that we count applications, not people, which is about 25% more. So there were 28,000 people seeking asylum at the end of 2013. In 2013, the largest number of applications for asylum were from nationals of Pakistan (3,343), followed by Iran (2,417), Sri Lanka (1,808) and Syria (1,669).
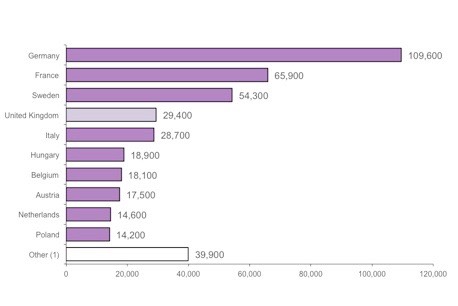
The 1,664 increase in applications in 2013 compared with 2012 was driven by rises from a number of nationalities, in particular from Syria (+681), Eritrea (+649), and Albania (+507). While Syria saw the largest increase in applications, it remains fourth for overall numbers of asylum applications. I noted what we might identify as attempted cheating; a large number of cases where the UK disputes the age (different from 18/19, mostly 65% being proved to be older). Looking to see what the rest of Europe does I found this [purple] chart. The numbers don’t quite match up, but that is to do with accounting periods, apparently. 411,000 for Europe, the EU27. Changing this to a % per head of population, the UK drops to 16th. Across Europe, the top three nationalities applying for asylum are Syria, Russia and Serbia. Something like 4% of all applications to stay are turned down (or withdrawn). 60% of asylum applications were refused, but it is not clear what proportion can then seek to re-apply, nor whether re-applying has any success.
5 Here’s a curiosity, from section 13 of the UK Dec 2013 immigration figures: The highest number of passengers refused entry at port and subsequently deported involved nationals of the United States (2,030; 14% of the total) who have also shown the largest increase compared with the previous year (+211 or +12%). The second and third highest involved nationals of Albania (922) and Brazil (885). Nationals of the United States and Brazil who are not coming to the UK for work or for six months or more do not need to apply for, and be issued with, a visa prior to arrival. The first time that they can be refused entry will therefore be on arrival to the UK. Which does not explain why they might be refused entry, does it? The Americans form by far the largest group of visitors to our shores, 28% of the total 12.9 million (journeys in 2013 by non-EEA visitors). But 1 refusal in 1800 arrivals might be mostly failed paperwork.
6 Net migration also varies; 19% Luxembourg,
Damn, saw the opportunity and missed it. I assume this is a local effect for people who see, like I did, that there is a very nice life to be had in Luxembourg, with many opportunities to cross borders and take advantage where things are better just a short drive away. The biggest growth in LUX and EU transfer citizenship was from Belgium and Portugal.
7 Net gain for the EU was 1.7 million immigrants and a very similar number changed states within Europe.
Unfortunately for the figures, changing state in Europe does not include evaporation. Motion may be Brownian but escape velocity is not achieved at all often. Must be something to do with the partial pressure.
