
If you have a test, such as a medical test then the test is supposed to be positive (you have the thing tested for, which is usually not good) or negative ( you haven't got it, which is generally a good thing). That situation is bad enough, making +ve test result bad and -ve test good.
But...
But the test can fail. In two more ways; the result can be positive but untrue (a false positive) or it can be negative and untrue, a false negative. So there are four values that you might well be interested in.
Let's take an example. Whatever example I pick, someone is going to claim offence, so (i) hard luck and (ii) this is the real world and we have to learn about it. The reason for looking at this is that it is very easily turned into what is only a mess. The underlying issue is that this sort of thing is not definite, it is instead uncertain.
Let's suppose I have a test for 'stupidity', whatever that is. This is a binary state, in that you don't recover from it. Not all illnesses behave this way, but it makes the example a little more straightforward. My test works well 90% of the time; by which I mean that it somehow gives a correct answer 90 times out of 100. Suppose we have lots of evidence that the proportion of the population that fits the label 'stupid' (having caught stupidity) is 2%. This is enough information to create a sort of truth table. To make the numbers a little easier to work with, let's imagine we've done an awful lot of tests of samples of 1000 people so that our numbers work exactly. For each 1000 people tested, we'd expect 20 (2% of 1000) to be stupid, but for the test to find only 18 of them. Similarly, we expect 980 to be not stupid and for the test to work 90% of the time, therefore identifying 882 correctly as not stupid. So we could draw up a table like this:
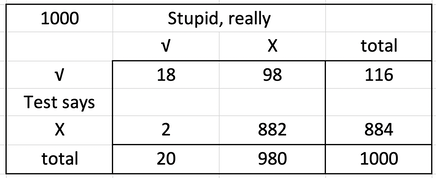
The table supports the information, that it gives a positive result (shown to be 'stupid') 90`% of the time. So the false negatives are easiest to identify (test negative, result untrue) - that's just two people, tested as not stupid but actually so. The false positives, where the test says they are stupid, but this is not so, is 98. This is something of a disaster then, because we have now labelled 100 people incorrectly; in a sense, we already knew this, because the test 'works well 90% of the time'. Doing the test again will help, but the likelihood of these second-cycle results also being wrong will leave us with 10 people still misidentified, on average. Really not very good.
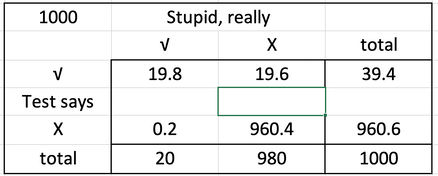
Perhaps we need for the test to be very much better. We can't change that 2% of people have caught stupidity (whatever the label means), but we might improve the test to giving a right answer 98% of the time, giving 20/1000 faulty results, but should find all the stupid people most of the time. Even so, in every 1000 people, this 'better' test labels 40 people as having caught stupidity when half of these will subsequently shown to be clear of the infection. You might correctly guess that the reason it is 'half' (it isn't exactly) is because the 2% failure rate of the test is the same as the infection rate.
All of which, because stupidity is something safe, in the sense that anyone reading this is, by their own lights and mine, not at all stupid, is very much a 'so what' issue.
Now suppose this is a screening test for cancer. Suddenly this is very serious, because one's reaction to a result is so much more extreme. Common cancers for men and women are prostate cancer and breast cancer, respectively. Many people will agree with a suggestion that screening saves lives. Is this true? All screening does really is operate a test to people who otherwise might well not 'present' themselves to a medical professional until they have themselves noticed that something is wrong and noticed enough to go ask about their symptoms. So screening might well catch early cases. But cancers can be benign or aggressive and the available data says that around ⅔ of these cancers are benign. That generally means that the medics would rather take no action but perhaps repeat tests at intervals, to check that the benign lump remains inactive. But it also means that screening produces an awful lot of 'positive' results, so how everyone deals with being told they have a positive test for cancer is obviously a big deal. That position occurs without anyone having discussed, usually, whether the test itself has issues. I found (quite easily) that the absolute risk of dying from breast cancer is about 1 in 1000 women. With similar ease I found that prostate cancer has an absolute risk very much higher, at a bit over 4%. Looking only at white men (ethnicity makes a dramatic difference) the absolute risk of dying from prostate cancer is about 1 in 25. ¹
Let's look at the male problem first because it is so large. Part of the problem, particularly when comparing sources from different countries, is that there is so little reliability that what looks the same actually is the same. The common screening test looks for an enzyme, literally a 'prostate specific antigen' (now there's calling a spade a spade), contracted to PSA. This is a simple blood test, but having a higher level of PSA (a positive test) does not necessarily mean there is a cancer, since several other conditions might elevate PSA. These cancers generally grow very slowly so there are issues with over-diagnosis and over-treatment (both of which are a waste of resources, both of which have their own attached health risks). What we need to know is that about 25% of those who test positive for the PSA test enough to be sent for a biopsy turn out to actually have prostate cancer. A large scale trial in the US showed that the group of men given frequent tests had a higher incidence of prostate cancer, but exactly the same level of death. So the screening did not change the end result, though quite a few men were given treatment (which in the US is expensive). What it changed was the level of information about who has a cancer. In Britain the question has to be whether the diagnosis helped in any measurable way. What is useful information is a change in the measured level of PSA. ²
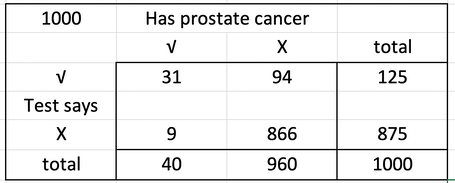
So our test here has a success rate of 25%. 25% of those that test positive are true positives. Can we assume that if we test 1000 likely men 1 in 8 is diagnosed? And that of these 125 only 31 have the cancer? Meanwhile if we think 1 in 25 will have the cancer (which is a fudge, I know, not least because it depends on how we choose the sample 1000 men to test) then we'd have a table like this, which, if nothing else makes us start to ask the right sort of questions. And on these figures, faulty though they are, we have around 10% with a wrong result; that's the 94 in 1000 likely to have a serious scare (also not good for their health) and the group for whom the test didn't identify as having a problem.
This goes quite some way to explaining why, in the USA, screening occurs while in the UK men are encouraged to be aware and to present themselves to medics if they show symptoms. The end result is very much the same in terms of deaths from this cause. The UK approach produces far fewer intrusive operations that prove in some sense unnecessary. Would the position be different if you could function without a prostate and no great inconvenience?
If you can find me better figures for the very real case of prostate cancer, particularly what I identify as 'not good enough', the number of men in our selected thousand who would have cancer at the time of testing, I would appreciate it.
One way to relate to your own concerns is to see how sensitive your model is to change. Suppose the false negatives are very low, so that maybe the bottom line reads 35 965 1000; this is better, because only 4 men have not been found who (probably) need treatment. But if the bottom line moved the same amount the other way, to 45 955 1000, then we have 14 missed, a dramatic increase in the proportion of people we think ought to be having treatment.
1 Figures from https://www.ncbi.nlm.nih.gov/pmc/articles/PMC4520076/. In 2011 there were 22.2M men in England and 10,800 died with this as the recorded cause in 2012. Which is 1 in 2056, but that's just one year, when you'd expect something like 370,000 men to die (1/60th), more like 1 in 34. Between 2008 and 2010 (table 3 of the linked paper) 639,000 white men died, 25,400 of these from prostate cancer, which is 1 in 25 in close agreement with the lifetime risk of 4.3%.Quite different from this is being diagnosed as having this cancer which turns out to be 1 in 8 as a lifetime risk. [Best estimate of 13.3%] in the period 2008-10 96,500 men were diagnosed as having prostate cancer, which is 1 in 230, while the 1 in 8 figure refers to a diagnosis as a lifetime risk. Does that mean that around 75% of those diagnosed survive having the cancer?
2 I came across a tale of Rudi Giuliani: aired in New Hampshire on October 29, Giuliani said that “My chances of surviving prostate cancer, and thank God I was cured of it, in the United States: 82 percent. My chances of surviving prostate cancer in England: only 44 percent under socialised medicine.” Sample source. Do read it. The underlying problem here is that the US uses a 5-year survival rate as the measure of success. The US does screening (of males for this cancer) which gives early knowledge of existence. It has no effect at all on the death rate and there are some very large scale data that illustrate this. So one well-quoted report shows that per 100k men, 13.6 US men get the disease and 49 UK men. Which suggests that the UK is bad for this, but is not at all true, because, not unlike coronavirus, we have a lot of undetected cases. What happens in the US is that early detection means that 5 years later 98% of identified cases are still alive (but many fewer in 15 years) while in the UK, where detection occurs later (more nearly at a time when action would be considered, 74% are alive 5 years later. Mortality rate is a good measure, five-year survival is a bad measure. It is a bad measure because in both countries the death from prostate cancer—the mortality rate—is very much the same, 26(US) vs 28(UK) per 100k males. Britain might reduce that figure if men could be persuaded that prostate cancer is worth taking note of, being 'the biggest killer after lung cancer', according to Cancer Research. However, since 1 in 8 men will at some point in their lives be diagnosed as having the cancer, do not confuse diagnosis with death risk. The more we test for it (again, like covd-19) the more cases we find; like covid, the older you are the more at risk you are; prevention is not obvious, the test is not particularly helpful. Estimated lifetime risk is 1 in 6 (18%) for UK males born after 1960. The situation is very much not helped by interested parties such as those chasing funding. So incidence is high; the question you need to ask is whether a positive diagnosis changes the way you live or whether having a cancer will change what it is you can do in your life. The visceral reaction of panic does nothing to help but does a lot in encouraging money to be thrown at the issue. Mortality rates have risen in the UK since 1970 by 18%; this is not explained, but could easily connect directly to living longer. That comment is countered by the prediction that the figures will fall from 56 per 100k males to 48 by 2035. You could usefully look at the ONS figures on mortality for context. Such as here. Or the latest annual figures for the UK. I had a good look at the 2014 data, which identifies the leading five causes for each age group. For example 4.4% of 65-79 male are deaths from prostate cancer (ICD10 code C61), which you might compare with 23.6% for suicide at 20-34 and 12.6% at 35-49, 15.4% of the 5-49 male age group, easily top of the list. For women breast disease, C50, is significant (and top), 11.3% of 35-64 deaths, 10.9% of 20-64 deaths. I felt frustrated that I was not being offered the full spreadsheet to view. Perhaps it is available elsewhere.