Global warming => melting ice => rising sea levels or does it?
Global warming will affect the amount of ice on the planet. Melting sea ice will have little or no effect on sea levels—dear old Archimedes’ principle explains that the floating ice displaces its own weight, so we would expect any changes to be small, even inconsequential.
What would change sea levels is a change to the massive amounts of ice held on land. This means where? Let’s look first at the north pole.
The north pole is located in the Arctic Sea (it is not really an ocean because the thing is shallow and small), at a position that means you cannot stand at the north pole, you must walk, since the ice there is moving, so Ranulph Fiennes explained to me, at around 4mph. However, there is a good deal of ice on the Canadian islands, Greenland and that long north coast of Russia.
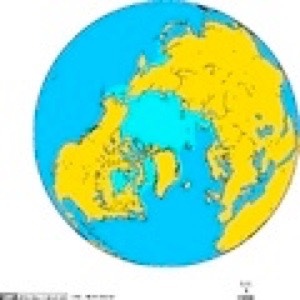
Here are two pictures of the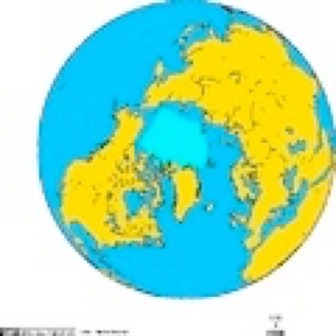 northern ice-cap. On the left is an averaged image of September 1978-2002 and on the right is February for the same period.
These don’t tell you what any changes are, they just give you a feel for the scope of the ice cover recently. Be careful of images that don’t locate the time of year. The sea ice is typically 3-4 m thick and covers 9 to 12 million sq. km. That's 27 to 48 thousand cubic kilometres, probably at the lower end of that range. Let's call it 0.03 million km³.
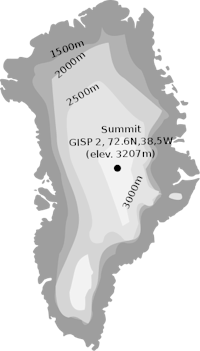
The ice sheet covering Greenland covers around 1.71 million km² and contains about 2.6 million km³, a lot more than the Arctic.The grey diagram here (Wikipedia) helps, but this is only showing a single land area. However, it is significant because the Greenland ice sheet is second in size only to that of the Antarctic. As you might have realised from the figures, the sheet is thick, at a median of around the 2km mark. If all of this sheet melted, it would cause the sea to rise by 7.2 metres.
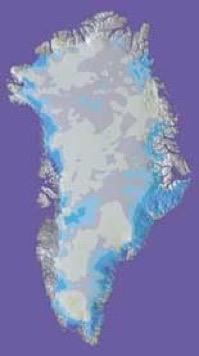
Unsurprisingly, there is little agreement over predictions as to the rate of melting of ice—I found various estimates suggesting all of Greenland would be clear as soon as 2013, 2030 and at the far end of the century. The point of chasing the Greenland ice-sheet is that it is the most susceptible to global warming as it is the climate of the Arctic that is most likely to change—and that is showing the most evidence of change. Now that ‘we’ are looking harder at the ice, it shows a trend of [a loss of] 195 cubic kilometres per year [Science Daily, 20081010]. Google the gravity recovery and climate experiment—GRACE—the source of the purple picture on the left. Much of the Grace site tells you what may become available rather than what has been discovered. The 195km³ figure represents a 0.5mm sea level rise, so you’d think “So what?”. The ice loss changes are not well understood and newer models suggest that loss rates will tend to rise—that is, the annual figures will go up and the whole process will accelerate, at least for a while, as the effect of the melting makes other factors come into play. Basically, we don’t know as yet, but we need to be aware of the progress of the ice loss, as what happens in Greenland will be reflected similarly in Spitsbergen, Iceland and the Canadian islands—the north Russian coast is less affected, I guess because of the mass effects of the continent in opposition to sea effects.
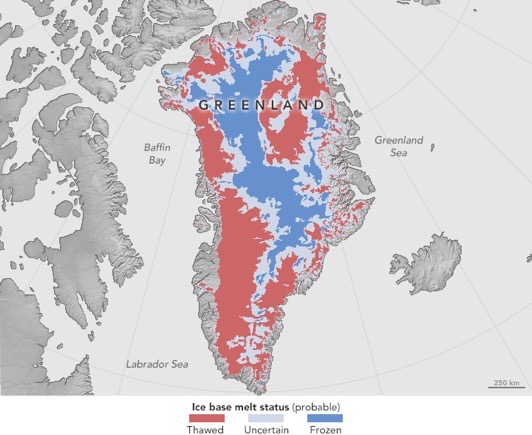
This red and blue image comes from GRACE up to 2013, assesses the state of the ice where it meets rock. It does not say this ice has vanished! ¹
Figures are skewed already by the exceptionally warm summer of 2007; data like these are strongly affected by an outlier and we don’t yet know the extent to which any figure is exceptional. That is the fundamental problem with climatic data—there is a large amount of variation in the figures anyway, so trying to recognise trends is a fraught business. In turn, we should not assume or argue that any short-term trend does not occur, but we should attempt to understand any fluctuations.
In this context one long-term concern is whether we will cause or have an ice age when the planet reacts to the loss of ice. The short-term (political and selfish) view says that is a future problem. That same attitude results in instant claims for ownership of land revealed, particularly over mineral rights—this is old news to those that follow such topics.
A nice point is to wonder how much melted ice refreezes without reaching the sea. Other factors to look for is the total floating ice—if the volume rises, so does sea level. Science Daily 20091103 reported that the variation in estimates of total run-off vary “by a factor of five from 50 gigatons (GT) to around 250 GT, and this level of uncertainty makes future predictions almost meaningless.” Too right. 2016 measures say we gain 400gT per year, see the bottom of this piece for a diagram.
It is easy to find scare-mongering press coverage. What is difficult is to find fact among the opinion, to distinguish discovery from repetition and to separate prediction from measurement, especially with regard to trends, as there are far too many un-, non- and dis-numerate folk out there all too ready to take any two points on graphs from differing sources as long as the trend is in the direction they want to write about. If you research this, be sure to find sources using the same data sources for comparisons!!
An illustration of what I was writing about above is shown in the trends shown as reflecting (pun) the albedo effect. To quote Treehugger: “Declining sea ice is a self-reinforcing trend because of what is known as the albedo effect. Ice reflects up to 70 percent of the sunlight that reaches it, while ocean water reflects only 6 percent and absorbs the rest as heat. This means that as soon as a small amount of sea ice disappears and exposes the underlying ocean water, the system starts absorbing more energy, which leads to further ice melt. Dangers associated with this runaway warming scenario include rapid destruction of diverse ecosystems that support polar bears, seals, and walruses, among other organisms; a thawing of the Arctic tundra, which can release copious amounts of the greenhouse gas methane; and increased warming of nearby Greenland” There’s a video exposition here, but it takes forever to load.
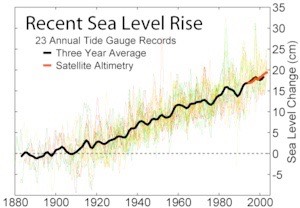
The consequence of loss of ice that affects the most people is the rise in sea level. The last 20 years shows a rise of 3.4mm per year, whereas the century-long average is 2mm/year. There is a model (see equilibrium line altitude) that says the maximum sea level rise will be 800mm. Wikipedia (sea level rise) gives figures from 90 to 880mm rise, median 480mm. So what does that mean? I can find oodles of end-of-the-world guff, but very little showing the effect of relatively small changes. No doubt that doesn’t sell newspapers.
The qualitative effects of a rise in sea-level (as the previous link to Wiki) “may include increased coastal erosion, higher storm-surge flooding, inhibition of primary production processes, more extensive coastal inundation, changes in surface water quality and groundwater characteristics, increased loss of property and coastal habitats, increased flood risk and potential loss of life, loss of non-monetary cultural resources and values, impacts on agriculture and aquaculture through decline in soil and water quality, and loss of tourism, recreation, and transportation functions.”
What I want is some quantitative data, so as to have an idea how to rank these dire consequences. I find clutter in subjects such as: relative sea level rise (it matters if you live there); the relative volume of the shouting, such as the Pacific islands, when the Netherlands and Bangladesh are likely to be hit harder and sooner (I think, but any Polynesian is looking at home and their % losses, so they’re right by their lights); bias of the my-back-yard type. This list (of places shouting) will grow, I suspect.
I find that sea level changes are not uniform around the globe, which is odd. A good site to look at is here, at flood.firetree.net I stuck to a single metre rise and saw dramatic changes to Holland and Denmark, but also Egypt; not as much as I expected in Bangladesh, but the Shanghai to Beijing coast changes were a surprise to me. Louisiana and the northern coast of central America is (would be) hit quite hard, and I noticed significant effects around the Amazon, so I looked at other large rivers, and found significant effects I had missed around the Black Sea. I disregarded the effects on the Caspian that were shown.
Here’s a comment from the Greenpeace site: “It is not only small island states that need to worry about sea level rise. More than 70 percent of the world's population lives on coastal plains, and 11 of the world's 15 largest cities are on the coast or estuaries. Over the 20th century sea levels rose between 10 and 20 centimetres (4-8 inches). The IPCC puts predictions of 21st century sea level rise at 9 to 88 cm. There are many variables – including how much the expected increase in precipitation will add to snow packs and, most importantly, our greenhouse gas emissions over the next decades. What we do know is that even a small amount of sea level rise will have profound negative effects.”
The Greenpeace article continues:
“It's worth keeping in mind that changes in sea level do not occur uniformly around the globe. There is actually a fair amount of difference in sea level rise in different parts of the world due to ocean circulation and wind pressure patterns. The effects of storm surges and spring tides need to also be kept in mind when evaluating sea level rise impacts.”
I understand how sea levels could rise by different amounts. I do not understand how levels would remain different over time. Any reader who does understand, please explain this to me and I will include your answer here (or on a related page, if lengthy).
DJS 20100109
edited for numerous typos, 20100515
small edits, 20121011
1 http://earthobservatory.nasa.gov/GlobalMaps/?eocn=topnav&eoci=globalmaps and especially the snow cover. You might like the animation of the data; bear in mind that the pictures can’t show what the sun doesn’t light, which explains the apparent lack of snow in deepest winter.
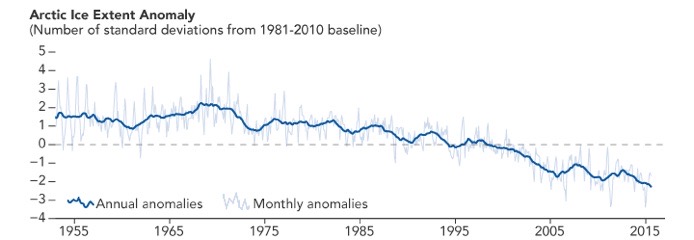
This from the NASA GRACE site. On the same page I found 2016 max/min to compare with the two pictures higher up this piece. Below that, the other pole. This is sea ice, not total volume.
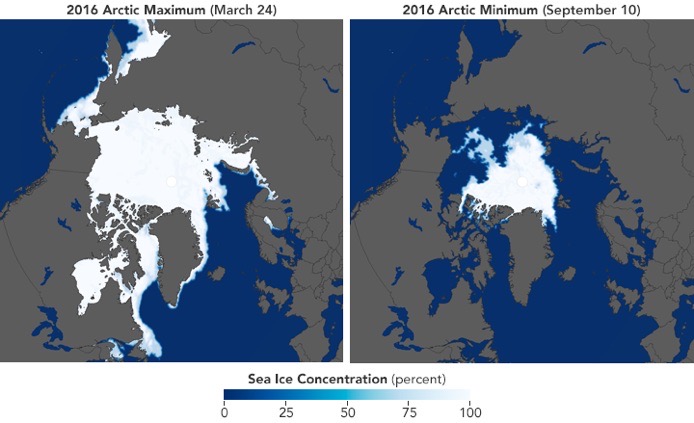
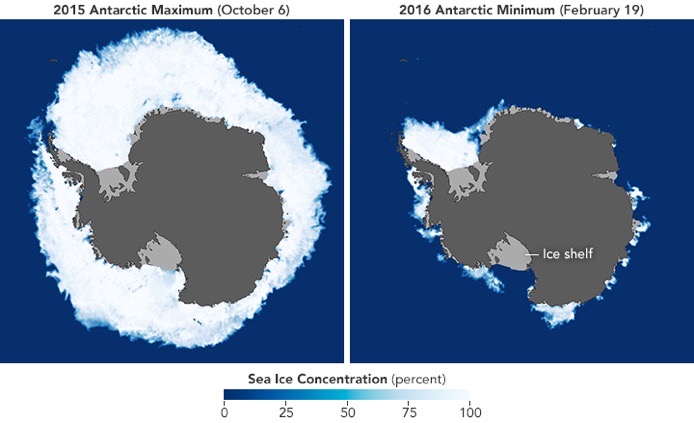
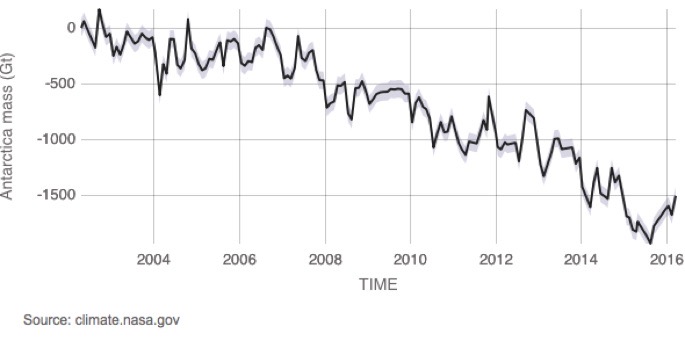
For the land ice changes, go here instead for the current data. Or watch a video Older Arctic Sea Ice disappearing 1993-2016 here. Antarctic ice mass, Greenland ice mass. There is no reason yet to predict a consequent rise, though some of the NASA site does suggest this will happen to the sea ice. these two together are losing a little over 400gT per year. That’s 400gT of extra water every year.
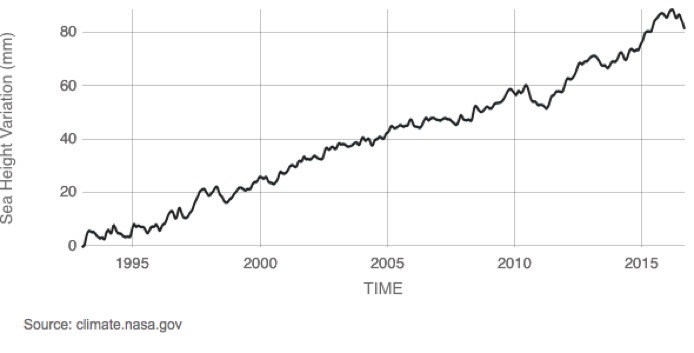
So you expect the sea level to rise. Taking a baseline from 1993 we have this at the moment I copied it, 82mm higher. Big deal, you say. When the zero is set at 1870, the gain is now close to 200mm. While that is not the metres we need for the large changes predicted by disaster-mongers, it is surely big enough for us to see some effects we don’t particularly enjoy.
Additions 20161201