
I am in an odd position at the point of writing this. It is 15 years since I stopped teaching in Britain and at least 6 since I last taught anything at all. The lack of daily practice with maths creates brain rust and I'm afraid this rubs off only with repeated activity. My brains still work, I hope, but the maths bit is what has rusted.
Context at the time of writing is much fuss about coronavirus, so-called because the image of the virus looks a little like a corona. In Mandarin it is a crown-virus for the same reason —so says the boss, who spends many hours reading about this, since Wuhan is what she thinks of as 'local'. Wuhan is, for those who haven't looked it up, halfway between these pairings: Shanghai and Beijing, Hainan and Tianjin, Chongqing and Shanghai. That places it pretty much in the middle of the heavily populated eastern side of the country and it is an excellent place for an epidemic to begin. Given that this is a flu-like virus it is easy to mis-identify it (and hence any urgency in what you might do about it individually) and it spreads easily since it is a lung infection. Worst, it hit the Chinese New Year holiday (CNY, which some western press decided to call the lunar new year), which is a time when the Chinese demonstrate that the western idea of travelling to see family at Christmas is only a pale imitation of the Chinese concept of following the same idea. I think if the initial case had been just a few days earlier we could have seen a different order of magnitude in early infection.
Q1 The sensible media (by which I mean radio, actually) has chosen to describe transmittability as a number of people that each case will infect, a number around 3, plus or minus maybe 0.5. Time for some maths: what sort of model would you start with?
If we assume that each person infects exactly 3 others and that the population (people available to be infected) is large enough, then the number of people infected after n cycles of the infection period is 1+3+3²+3³+.....3ⁿ
This will continue to grow in the same way unless some changes in behaviour occur. One factor to consider immediately is just how quickly a nation state can react in comparison to the incubation cycle. With a new infection one of the significant difficulties is discovering how the infection propagates and in which period of the illness one might be infectious. For example, if one were transmitting the disease while unaware that one was yet ill, then many people will be acting in the belief that they are 'well' and will either go help the ill or will do very little (stay at home, continue as if there is no infection at all) or scarper rapidly to elsewhere. This last case causes a dramatic spread of disease and makes it very difficult for any sort of authority to reduce infection rates, Indeed, in this situation the spread of disease will be very rapid indeed.
Mathematically, this is a geometric series, so it would be correct to describe it as geometric growth.
Q2 I found it very easy to discover press contribution that talked about the growth being exponential (example). Decide, or better still prove, whether geometric growth is bigger, smaller or the same as exponential growth.
Suppose that the growth was exponential; then the rate of infection is directly related to the number infected, dx/dt = kx => x= Aeᵏᵗ.
At this point you might attempt a read of [1]. My own thought was that this assumes an awful lot of the sort of content which would usually be explained in academic papers. So I looked instead to see if I could find the numbers of cases reported. A win for wikipedia here.
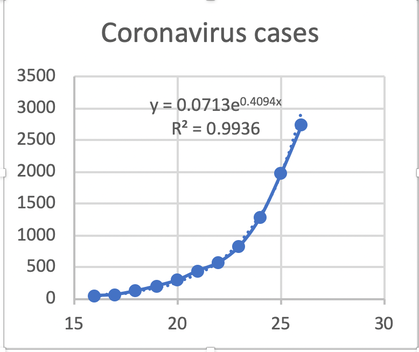
Q3 Put these figures into some sort of predictive graph and identify a suitable model.
Compare this with the R₀ figure from [1] of between 3.3 and 5.5 and comment.
Jan 2020 date 16 17 18 19 20 21 22 23 24 25 26
NHC cases 45 62 121 198 291 440 571 830 1287 1975 2744
You should find that there is a curve of the form y = Aeᵏˣ. Here, x is days and Y is cases declared by the National Health Commission. Try [3] for the current situation. I'd prefer to use x=Aeᵏᵗ; changing the initial day only changes the value of A (you should demonstrate that for yourself). A is what [1] is referring to as the initial condition, i.e what happens when t=0. It is less obvious what the value of k, which equlas 0.4094) indicates. However, given that the medics talk about each person infecting another 2.5 or so, that looks like the reciprocal of 0.4094, or 2.44.
Q4 Comment on that suggestion. Do you think the terminology is inconsistent, even confusing?
Q5 Imagine you are someone involved in recognising what is occurring. Imagine you are included on 18th January and that the figures for the cases you have are only the 45, 62, 121. What is your prediction of infection rate (people infected, 6k in Aeᵏᵗ) for the 20th and 21st? How does this change when you are told of 198 cases for the 19th?
Q6 Continuing the idea in Q4, put yourself very much closer to the problem and imagine you were aware that something might be happening as early as the 13th January, with the available case numbers being 2,3,5,9. Being experienced (as you are, now), you know to model this with an exponential. Find an approximate solution and predict the numbers for the 16th, being the moment when figures reached the notice of the international press. Unfortunately there is disagreement whether cases count towards the figures, so another equally valid count goes 2,3,4,6. Use these to produce a second set of figures and compare.
One of the significant problems you can now appreciate is that it takes time to ascertain that there is a new disease, to test for it and therefore there is a significant delay to actually discovering the early cases. You might imagine that a sharp medic might send material for testing and that this might build in a delay of, say, three days cycle time between suspicion that this is a different disease and having any confirmation that this is so. Thus, if in Q5 there are two cases from the 10th confirmed on the 13th, when there are perhaps 6-10 cases (4-8 new cases), by the time these are confirmed on the 16th there are 45 cases but you think there might be 25 to 50. By now you would hope that either testing can be speeded up or that some controls can be put in place. It is round about now that deaths begin to occur and that will raise the degree with which this is taken seriously, probably causing additional resources to become available.
The news tonight, the 27th, put the 1/k figure at between 2.5 and 6, so k is between 0.40 and 0.17 (rounding to the nearest .01), which suggests that some of the modellers think there is, as yet, an awfully large number of undiscovered cases.
Q7 Suppose there continues to be a 3-day delay in confirming new cases. Assume that the 45 cases on the 16th is now very much agreed by all concerned. On the 26th the 830 from the 23rd is confirmed, but there is doubt that this is a complete count. What sort of numbers of cases are suggested by k=0.16 to k=0.18 ? How does that change the apparent 830 figure from the 23rd? That is, how many cases are perhaps to be discovered?
This morning the number of declared cases is 4545. This continues to be a very close fit to the original model, x=0.0713e^(0.4094t). That says that we have done very little to affect the spread of the outbreak. At this point we would begin to expect the virus to become modified by the population, as it changes in each subsequent transmission (so I understand); often one would expect a strain to weaken. News today says that the incubation period is 3-7 days with a maximum of 14 days. So quarantine periods will be set at 14 days and already there are schools in Australia asking travellers from infected parts of China to give themselves voluntary quarantine for 14 days. Followed by 'a medical certificate', which is asking quite a lot of the medical profession.
DJS 20200128
top pic from https://www.imperial.ac.uk/news/194815/coronavirus-outbreak-china-have-infected-thousands/
1 https://www.biorxiv.org/content/10.1101/2020.01.23.916395v1
3 https://gisanddata.maps.arcgis.com/apps/opsdashboard/index.html#/bda7594740fd40299423467b48e9ecf6
5 https://gisanddata.maps.arcgis.com/apps/opsdashboard/index.html#/bda7594740fd40299423467b48e9ecf6
6 https://en.wikipedia.org/wiki/Timeline_of_the_2019%E2%80%9320_Wuhan_coronavirus_outbreak
Q1 I see this as of the form (1-xⁿ) / (1-x) = xⁿ - 1, so say at eight cycles we have 3⁸-1 = 6560 cases.
Q2 eˣ = 1+x+x²/2! + x³/3! +.... > 1+x+x²+x³+... while |x|>1. E.g. e³≈20. So geometric is bigger than exponential. Surprised? Might you think that the press would opt for the bigger word if they understood?
More thought says this is not true: the geometric thing is a sequence, where the 'next' is formed by adding a term; the exponential graphs this sequence as terms are added:
so 1+x+x²+x³+... + xᵗ = xᵗ - 1 / (x-1). As t heads off to 'bigger', this heads to xᵗ⁻¹, which is clearly exponential and yet marginally less than some equivalent eᵏᵗ curve. What I wrote first is not wrong, but it implies a use that is not what we do. Nor what we meant.
Q3 I shoved the data into Excel, added an exponential trend line and asked for the formula to be displayed. The R² value says this is a very good fit. Quite how we should interpret the values 0.07 and 0.409 is less clear. It is remarkable that x is the date for such a good fit.
Projecting these figures for a further four days gives 4500, 6800, 10,200, 15,300 cases respectively.
Changing the count for the first day so that there are 45 initial cases moves A to 33. Moving the initial cases to a single one makes day 1 the 7th of January and A=0.8312. In all cases the exponent stays at 0.4094.
You might play with your data to see how the prediction varies with far fewer days.
Q4 It cannot be the reciprocal, as that would suggest that infecting more people per carrier then reduces the number of people infected. There must be a multiplier instead, something like 6.
Q5 Still using Excel, then assuming an exponential and using the date for x, I got x = 0.0155e^(0.4096t) which predicts 306 and 503 for the 20th and 21st. Adding in the fourth data point moves the predictions to 323 and 539, actually worse. By this point you would hope to have found the numbers for. So 6k is around 2.5 people per case.
Q6 I got x = 0.0126 e ^(0.5023x) which predicts 2,3,5,9,14,24,39,64 - a remarkably good fit. On the other hand, if the figures began 2,3,4,6 they would continue 8 12 17 25, far less helpful.
Q7 I stuck new values of A and k into x=Aeᵏᵗ, using A=0.000005 and 6k=6 =>k=1, so as to have 45 cases on the 16th. This suggests that there are 49000 cases on the 23rd. That indicates that 6k is NOT representative of the number of people infected by any individual carrier.
Edit 20200129:
On 20200128, Tuesday, the new reported count of cases [6] was 4515. Compare this with x=0.0713 exp(0.4094t) => 4505. Wow!
On 20200129, Wednesday, the new reported count of cases [6] was 5974 and 6057 on [3]. Compare this with x=0.0713 exp(0.4094t) => 6784. At last the model is over-predicting and needs modifying—that is, the actions being taken are having some effect. New best fit exponential is x=0.0772exp(0.4053t)
On 20200130, Thursday, the new reported count of cases [6] was ....... and ... from [3]. Compare this with x=0.0713 exp(0.4094t) => ....
On 20200131, Friday, the new reported count of cases [6] was ....... and ... from [3]. Compare this with x=0.0713 exp(0.4094t) => ....
Do you not think it significant just how very good this model proved to be? Do you think you could have persuaded people that the numbers were going to be so large and so quickly that action would be taken? Could you predict how soon any actions would show any effect? For instance, would you expect the delay in evidence to be about the same as the infection period, the 3-7 days we now know? In which case, might you argue that 3 days is the earliest to see any effect in a slowing of the growth?
Now that some change has occurred, I suggest that the model needs resetting to reflect the changes that have occurred. This would be difficult, but maybe the last three figures would serve to show the degree of change that has happened. Alternatively, one would add a term of the form Be⁻ᵏᵗ to slow things down, where B might well be as big as the sick population when the effects were applied.
Edit 20200203
This morning cases in China now reported as 20,440 [6] for the 2nd, where my model of the 23rd predicted 52,000. So I am happy that there is change. However, the change in gradient is still generally upwards and it is the spread to other places that causes the outbreaks to need to be treated separately. That introduces new difficulties, such as defining/deciding where an area has its edges, so as to put a new case 'against' one site or another.
Edit 20200213
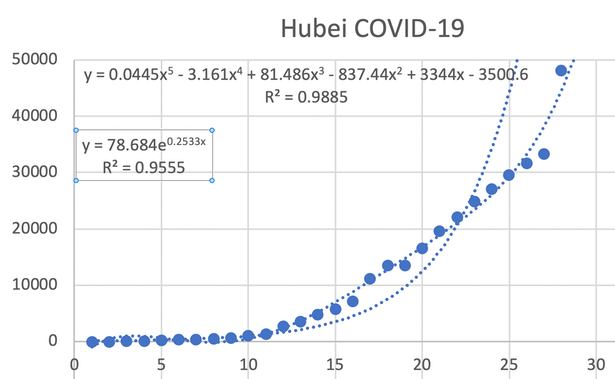
We now have some 60,000 cases within China [source 3], deaths past 1300. We count 9 cases in the UK, 50 in Singapore and HongKong. Hubei has 1310 deaths and 3451 recovered, of 48206 cases acknowledged. The sudden hike in cases from the 12th Feb (Day 27 on the chart) suggests a number of issues. One might be an inability of the authorities to get the people to comply to problems with recording, reporting and even acceptance that one may be infected. Another idea is that there is a lag in the reporting system that has somehow caught up. We seem to have an infectious period during which the infected person is (apparently) unaware that they are so, which lends itself very well to propagation. The Chinese have gone overboard about masks (the UK reports that they are unlikely to help) and its public spaces are remarkably empty. The blog associated with [3] is informative. The illness is now called Covid-19. If you want to 'play' with time series data, go here. I show the state of the data for Hubei, though I estimated data before the 23rd. That last data point is a distinct cause for concern. It looks to me as though there is an underlying trend that is in some sense 'trying' to tail off (so that the gradient edges to zero), but that newer outbreaks or pockets of infection are occurring, with some significant delay in discovery — which may be what happens when infectiousness is not evident. That would cause there to be unknown spread, followed by significant numbers—jumps in the data—of known infections, each of which has had an incubation period, for some of which they were infectious.
Edit 20200305
A report read dated 0302 says we've passed 89,000 ill and 3,000 deaths. Yet the flu, just in the US, has caused 32 million ill, 310,000 in hospital and 18,000 deaths just this season (Oct to now). link. And we 'know' about the 'flu. The death rate for Covid-19 is around 1% (and we don't know a lot yet, not even what the 1% IS 1% of), while the 'flu has a death rate of 0.056%, about 20 times less, but lower numerically. See.
Difficult to get this right for influenza, since the season is not over; 2017/8 gave 61000 deaths, 34200 for 2018/9. And that is just the US of A. UK 'now' figures here. Infection rates here are usually figured per 100,000 people in the ordinary population, so if we look at the 2017/8 season (link), rated moderate to high activity, [p21] gave 3454 admissions to hospital and 372 deaths (0.57 'rate', anything over 0.5 is rated significantly bad, 'very high'). Bear in mind that the UK targets vaccination against the 'flu, such that typically 70% of the 10.2 million over-65s, the 'most likely to suffer' group, are usually dosed with defence. For all other ages with 'any identified risk factor', some 6.8 million, 50% is a typical uptake figure [p36]. So the 'rate' as termed above for Covid-19 is around 1000, staggeringly high and highly dependent upon the way the local population behaves. I found it not possible to find an estimate of the numbers identified as having had the 'flu, but deaths/hospitalisations was around the 9% mark.
Look at this another way: using figures from here 3k deaths from 90k recognised cases suggests a 3.3% death rate (once you're known to have it); influenza in the US kills about 1 in a thousand, 0.1%. Meanwhile at the moment coronavirus in the US has killed about 9% of those known to have it. How many die depends significantly on the numbers ill and the aid available (as numbers go up, aid goes down). So at the moment coronavirus is successfully killing people at somewhere between 1 and 3%, while the 'flu kills about 0.1% (of those known to be sick with it). Hospitalisation rates (deaths/hospitalisation) suggest that 'flu and covid-19 are equivalent at killing people. The rates are highly suspect though, since it is so easy to have a mild case go unreported. In many ways it is more sensible to work from those admitted to hospital, itself a marker that the case is severe. The waters are muddied significantly when looking at self-reporting, where any cold is often described as the 'flu.
One thing we cannot know is how effective the vaccination process is, though I can find reports that look as though they answer just that. Apparently 50% is good and 25% is poor. Different reports refer to those already in primary care (meaning in hospital? Intensive care?) where effectiveness varies with the extent to which the vaccine was targeted at that particular virus; for example A(H1N1) in 2017/8 was around 70% effective but more like 12% across the spectrum of influenza that season. Link. Realistically the only merit of these numbers is that one assumes they are calculated the same way in other years, so they work for comparison between years in a given environment, not between different ones such as nations.
This is too much like trying to identify how much black there is in a complex picture rendered in shades of grey.
Essay 293 - Covid-19 charts charts published daily reflecting concerns and issues.
Essay 291 - Effects of an outbreak what it says, effects, but some description of what we have (and not)
Coronavirus (Y10+) modelling problems
Epidemics more general theory
Infectious disease looking at the 2020 problem, particularly effects of the reproduction number changing.
Viruses are very small