
 If you're a fan of Patrick Robinson, who writes books that include submarines, you will recognise this as one of the few deep stretches that permits Russian subs coming from the North to perhaps evade the listening posts that reach from Canada to Norway. It is perhaps the furthest northern sea water that stays ice free. wiki
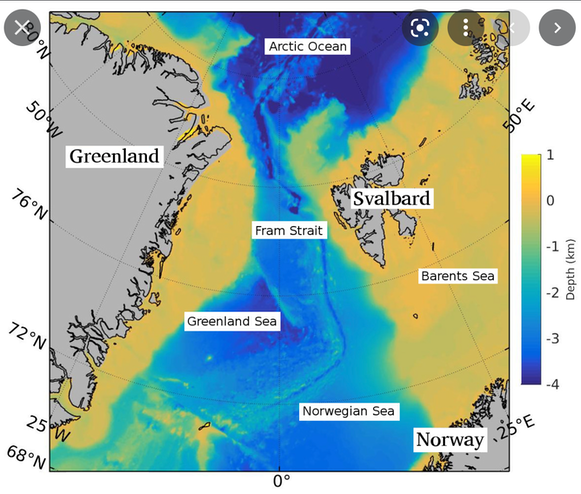
 . The channel is about 450km wide and the deep part (in blue) perhaps 300km wide. The strait is around 2600m deep [88]. The dark blue channel running through the gap is very deep. The importance of this is that this is the space through which cold water flows from the arctic and warm (less cold) water flows from the Atlantic. The warm and salty west Spitsbergen current flows north, just to the to the west of Svalbard; not so very far to the more west the East Greenland current sends cold and relatively fresh (meaning much lower salt content) water southwards. It is this current that is laden with floating multi-year ice, some 80-90% of all the arctic ice that reaches southwards comes through this gap, carrying it into the Atlantic. Why here, because of transpolar drift, ¹ which basically says there's more ice this side of the pole. In case you had not realised, sea ice is mostly fresh, 4 parts per thousand versus 35 in sea water. Drinkable when warm enough.
Not surprisingly then, this is a point at which we are measuring temperature pretty continuously, looking for change. In the past century, the sea surface temperature at Fram Strait has on average warmed roughly 1.9 °C (3.5 °F), and is 1.4 °C (2.5 °F) warmer than during the Medieval Warm Period.
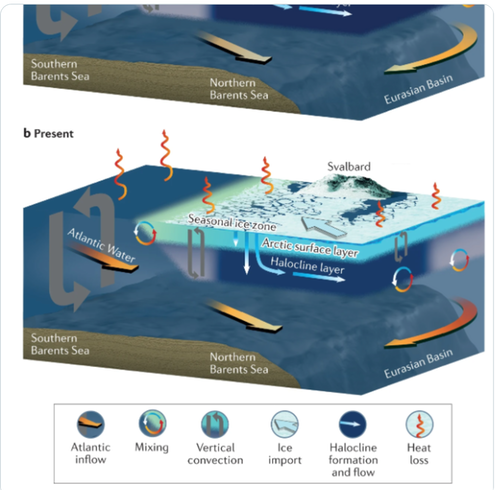
A recent study [83] questions the older models of how these waters mix. ...Indisputable evidence of the rapid changes occurring in this region. Understanding the past variability of this “Atlantification” is thus crucial in providing a longer perspective on the modern Arctic changes. Here, we reconstruct the history of Atlantification along the eastern Fram Strait during the past 800 years using precisely dated paleoceanographic records based on organic biomarkers and benthic foraminiferal data. Our results show rapid changes in water mass properties that commenced in the early 20th century—several decades before the documented Atlantification by instrumental records. Comparison with regional records suggests a poleward expansion of subtropical waters since the end of the Little Ice Age in response to a rapid hydrographic reorganisation in the North Atlantic. ...and thereafter it rapidly becomes largely unreadable, like this: Thus, in line with recent findings, we suggest that the most likely mechanism to explain the early 20th century SPG reconfiguration involves a freshening of the North Atlantic at the end of the LIA and a consequent weakening of the AMOC. This implies a post-LIA scenario characterised by contrasting hydrographic patterns with fresh and cold water spreading into the western SPG, whereas the Svalbard region bathed by the Western Spitsbergen Current experiences a gradual warming and more saline conditions. This interpretation is consistent with a cooling of the sub-polar northeast Atlantic and a general weakening of the AMOC evidenced in both modelling studies and reconstructions.
The underlying message is that the warming of the Arctic started much earlier than we had previously thought. This might mean that we need to reset our idea of 'normal', particularly that pre-industrial figure we seem to be setting as target for fixing climate change. Like you can see anyone with land north of Iceland agreeing to have it disappear under a kilometre of ice. Well, they will if they're suitably compensated.
I remember being told at the time of COP26 that the Arctic is warming three times more quickly than the planet as a whole with temperatures rising in the region by as much as 3 degree Celsius above pre-industrial levels. This is causing ice in the polar region to melt, which in turn raises global sea levels and submerges low-lying parts of the world. I found agreement later in [82] that it is certainly more than twice as much. Of course, less sea ice in the Arctic will cause more melting in a feedback loop. This will inevitably change the ecology (in a direction that suits us, edible fish). A warmer ocean will warm up the adjacent permafrost which sounds good but releases methane in quantity (bad; significant greenhouse gas 80x worse than CO2 on a per tonne basis). Did you know we've had wild fires inside the Arctic Circle in 2021?
The AMOC runs amok ²
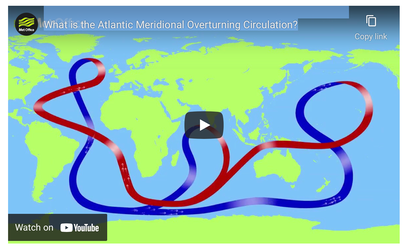
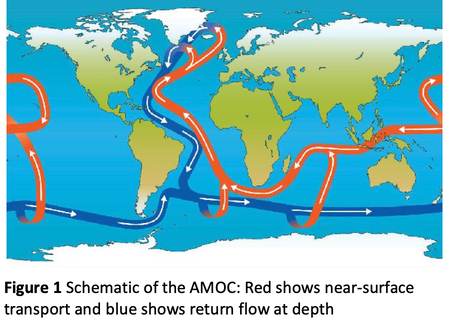
Now we come to the AMOC. No, not the Aston Martin Owners Club, but the Atlantic Meridional Overturning Circulation and that mouthful is why it is referred to as AMOC. This pic might even take you to the Youtube video. I think the chart is enough, that the red ribbon flips over to blue; that curl of red beside Britain is what we call the Gulf Stream, which loses heat by the time it reaches Iceland and drops down to the sea floor. Which rather says to me that it then picks up heat from the mid-Atlantic ridge which seems to be the same southward line. Better chart from [86] added showing that the current is not over the volcanic ridge. Even I can see that if an excess of fresh cold water is added as the current turns around at Iceland (Svalbard is a good bit further north), then the cold current will be less dense and therefore nearer the surface. That will, I think weaken the process. [84] agrees or confirms: Climate models suggest that the AMOC will weaken over the 21st Century as greenhouse gases increase. This is because as the atmosphere warms, the surface ocean beneath it retains more of its heat. Meanwhile increases in rainfall and ice melt mean it gets fresher too. All these changes make the ocean water lighter and so reduce the sinking in the ‘conveyor belt’, leading to a weaker AMOC. So the AMOC is very likely to weaken, but it’s considered very unlikely that large, rapid changes in the AMOC, as seen in past times, will happen in the 21st Century.
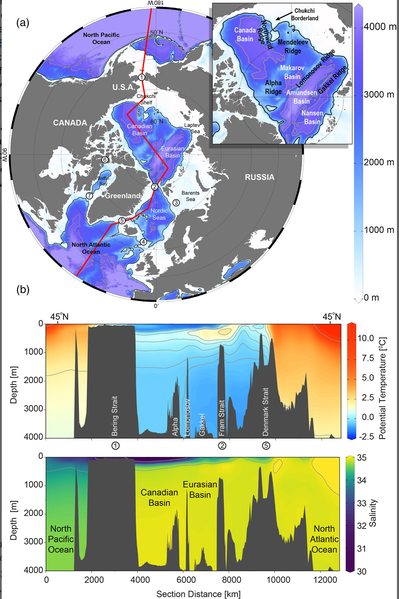
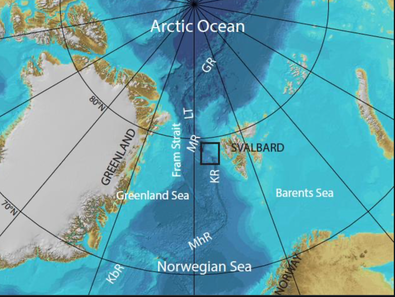
The smarter reader will agree with me that what happens in the Fram Strait (I almost wrote Fulda Gap ³) does not automatically mean that the Gulf Stream turning around both sides of Iceland (as in the lower of the two maps) mixes. There are currents missing from the display. The East Greenland current comes through Fram Strait and follows the coast around Baffin Bay and down to Newfoundland. I've added in a map of the Arctic with sections to show what is deep, or not. More detail by clicking the link, obviously. The space labelled Nordic Seas ⁴ is where I am referring to here. I have added a larger chart from [88] which, if you stare at it for long enough, expands on what I have written so far. There is a lot not known; we know that there is quite a lot of movement at depth but not exactly what that movement is, particularly whether any discovered flow is continuous (or perhaps it is cyclical, like a tide).
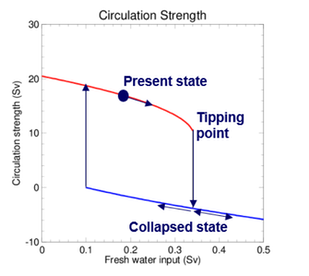
The critical matter is whether there is a point—a tipping point—at which we lose enough of the AMOC that we lose the Gulf Stream and probably screw up El Nino too. There are paleological records that point to sudden changes in the AMOC system and this worries the ecologists, as it should the rest of us too. That might not mean an ice age ensues, but it would more probably make our winters more like those of Korea, bitterly cold, while still being very wet. Not at all nice. Such a switch is hysteresis, which school scientists usually come across in A-level Physics, but this is the same thing. If the model is right (it should be, the record shows that the AMOC has restored) then reversing the freshwater input—quickly, early—brings us back to the left on the blue line with the hope that the salinity drops enough to flip back. Mind, if we (let ourselves) get into this state, we'll have all sorts of other things going wrong too.
What I've read says that tipping point is unlikely to occur this century, but that assumes that the models we have are sufficiently correct. The new study says we've started from the wrong place, which means, to me, that the overall rise in temperature from 'normal' or pre-industrial is bigger than we had thought and so perhaps out models need some recalibration, to the extent that a change in base temperature affect them. I point out that the whole point of models is that we must check the output against the real world, else we have no idea how good our model is. We need it to be good enough to make decisions (really, to take wise actions); we need our models to be seen as reliable so that when the guys in white coats tell the politicians, these decision makers actually do that rather than duck, than kick a can down the road, prevaricate – all those things that keep their own self-important lives relatively stable. Which is daft, because they are there so as to make decisions, not to avoid making them. More evidence that our systems are flawed or failing.
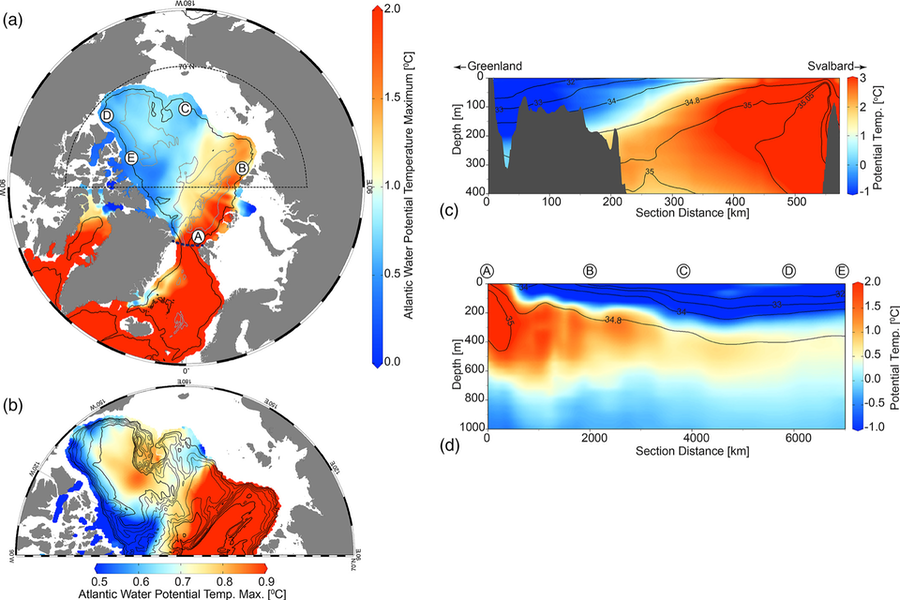
Maps of Atlantic Water potential temperature maximum (° C) for (a) the Arctic Ocean and (b) the sector bounded by the thin dotted black lines in (a). Bathymetric contours in (b) are in intervals of 500 m; the deepest contour shown is 3,500 m. Sections of potential temperature (° C, colours) and salinity (contours) (c) across Fram Strait from west to east along 80° N (thick dotted line shown in panel (a); cooler, fresher water in the west flows south, while the warmer, saltier water to the east flows north, entering the Arctic Ocean from the Nordic Seas) and (d) along the 1,000-m isobath moving cyclonically around the Arctic basin with letters A–E corresponding to their locations marked in panel (a). Data are from WOD18, 2005–2017. [Figure 5 from [88]]
I refer back to a piece [90] I read before COP26, at a time when the media were, quite rightly in my view, trying to persuade us to take the idea of climate change seriously. This points to the AMOC as having two states, a fast, vigorous form and a slow, weak one. The switch from fast to slow puts our futures in jeopardy because of the changes that will occur to the expected weather systems. Anyone recognising catastrophe theory will understand that knowing exactly what triggers the 'when' part of such change is considered unknowable–which works in both directions, both going to a bad state and returning to a good one. The hysteresis chart above goes some way to exhibit this process. Which means that while we should be trying hard to avoid a state change, if the change occurs anyway then we have a long wait for the change back to occur.
DJS Early December 2021
[81] https://en.wikipedia.org/wiki/Fram_Strait
[83] https://www.science.org/doi/10.1126/sciadv.abj2946
84] https://www.metoffice.gov.uk/weather/learn-about/weather/oceans/amoc
[85] https://www.youtube.com/watch?v=eu7ZDi2wHqY
[87] https://www.savingourplanet.net/post/is-the-amoc-running-amok
[88] https://agupubs.onlinelibrary.wiley.com/doi/full/10.1029/2018JC014378 An excellent description of the Arctic Ocean, with loads of detail.
[89] https://en.wikipedia.org/wiki/Beaufort_Gyre
[90] older piece, read by me when new; https://www.theguardian.com/environment/2021/aug/05/climate-crisis-scientists-spot-warning-signs-of-gulf-stream-collapse?utm_source=eml&utm_medium=emlf&utm_campaign=MK_SU_SOINewsletterCanvas&utm_term=Email_RC_UK&utm_content=variantA
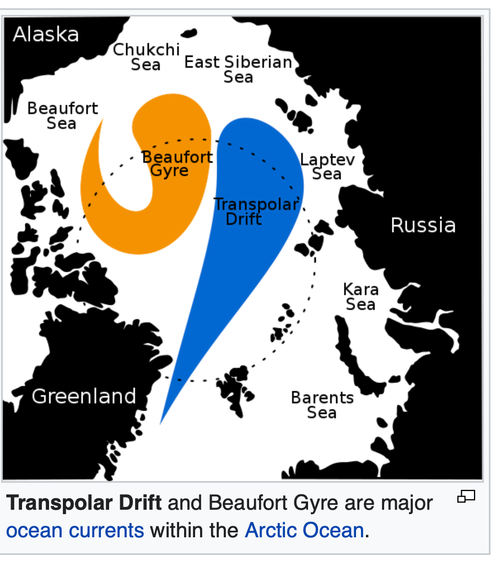
1. Transpolar drift and Beaufort Gyre, shown to the right.
The two coloured patches start wide and move to the narrow end. The transpolar drift mentioned above is thus identified as a major cause of movement across the Fram Strait.
The Beaufort Gyre is a clockwise circulation of sea ice and so this is the major store (10%) of fresh water in the Arctic. This has been studied extensively as it has shrunk.
2. Ed, the guy who writes the newspaper headlines, is saving this one. Sub-Ed, his junior (who also goes for the sandwiches at lunch), is looking forward to the moment. No doubt they will try to wait, but cannot possibly be second, so inevitably the line will be used incorrectly. I think it might work as a question. Just to check, I googled this and, sure enough here we are: Is the AMOC running amok? [87] . That piece is way too short for such a good headline, says Ed.
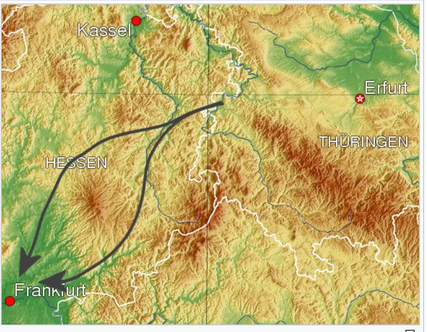
3. Fulda Gap. A need-to-know thing if you read about putative wars in Europe. Look at the colours and think like a tank commander; you want to stick to the yellow with a minimum of river crossings (or entirely manageable crossings). The river you can see is the Rhine. Napoleon used the route – or something very similar—after the Battle of Leipzig; the same route was thoroughly explored in the Cold War (that's 1947-91, I'm told). The US XII Corps used this route to advance around Easter 1945 and they occupied a large amount of ground very quickly (blitzkrieg in reverse). A long look at a map suggests another route across the North German plain, as if heading from Poland to the Netherlands, and a third possible route along the Danube Valley.
Tom Clancy writes about tanks in much the same way at Patrick Robinson does about submarines; Clancy writes also about things not involving tanks. Red Storm Rising requires the Fulda Gap. I do not think Robinson refers to the Fram Strait once.
4. Nordic Seas: the rectangle of water between Iceland and Svalbard, Norway and Greenland. Unsurprisingly, the water nearest land collects the name, so we have the Greenland Sea, the Norwegian Sea and the Iceland Sea. The Barents, north of Finland is not included. I seem to remember there are a dozen polar seas, but if might be fifteen. ⁵
5. Addendum, since once I knew about seas:-
Within the northern polar circle, with the name sea attached.
Roughly anti-clockwise: Iceland, Greenland, Norwegian, Baltic, Barents, White , Kara, Laptev, East Siberian, Chuchki, Bering, Beaufort, Labrador. You might add Baffin Bay, Hudson Bay and maybe Hudson Strait.
I found a footer reference on Wikipedia that says these are the Arctic Ocean seas: Amundsen Gulf, Barents, Beaufort, Chukchi, East Siberian, Greenland, Gulf of Boothia, Kara, Laptev, Lincoln, Prince Gustav Adolf, Pechora, Queen Victoria, Wandel, White. Which is 15, 13 of which have sea in the name, but leaves out the seas adjudged not in the Arctic Ocean: two of the Nordic seas, the Bering, the Baltic, the Labrador. So that would make the polar seas perhaps seventeen or nineteen.
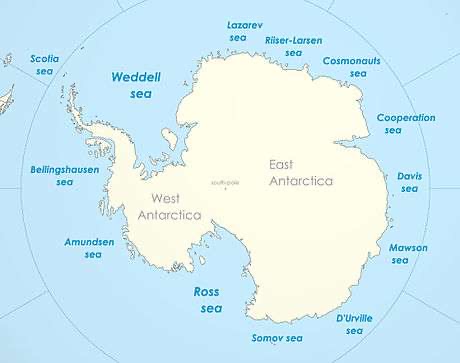
Down south, clockwise and all of it in the Southern Ocean but on some maps some is in the South Indian Ocean; Ross, Amundsen, Bellingshausen, (Drake Passage), Weddell, Scotia, Lazarev, Riiser-Larsen, Cosmonaut, Cooperation, Davis, Mawson, D'Urville, Somov. Twelve with 'sea' attached, though the Scotia Sea is outside the Antarctic circle, so you might exclude it. Some of these are not agreed by all concerned and I struggled to find a satisfactory map. Best source found. Quite how you decide which to count, I don't know; I see between four and fourteen. What a mess. The 'King Haakon VII Sea' unites the three from Lazarev to the Cosmonauts, but I think the (very few) people on the ground there probably get the say. Why would ytou bother to disagree? The more labels there are, the better the understanding of quite where you are working
This map is from the entry on the Lazarev Sea (wikipedia) but for once wiki lets itself down a bit, showing the lack of agreement. As for Google Earth it has been bad at watery names since inception. For instance, how about being able to separate out the water features like rivers?
DJS 20211202