
This page is made up of comments and observations made during April 2020, with the graphs much as from Essay 293, corrected to show to the end of April. The daily chart from Worldometers is omitted here unless I find a way of recreating it for the correct date.
1st April: a report in the Guardian says that China has been looking at their asymptomatic cases, producing a suggestion that there were 40,000 asymptomatic cases to add to their 80,000 counted. This does not tally with the US CDC comment that about one case in four has no symptoms, so there is more to be discovered. New Chinese comment says about 60% of those (recognised as) having caught the virus had no symptoms. Further, that a symptomatic carrier infected 6.3% of close contacts, while an asymptomatic carrier infected 4.4%. The issues I expected to see yesterday, about freeing up the movement restrictions in China, were found this morning. Meanwhile, migrants are returning from Iran to Afghanistan, of course moving the virus in volume. I noticed last night that we were shown tv clips from around the world (and London is not in England in this regard) demonstrating a lack of understanding of what two metres is and how to measure it— or that this is a regulation simply ignored as yet. Local to home, the understanding is either well understood or simply ignored. That, or there are very many more gentlemen sharing the same roof than I thought, many of whom wear hi-vis jackets at work. I wonder how a house of multiple occupation (HMO) acts—as one household, or many?
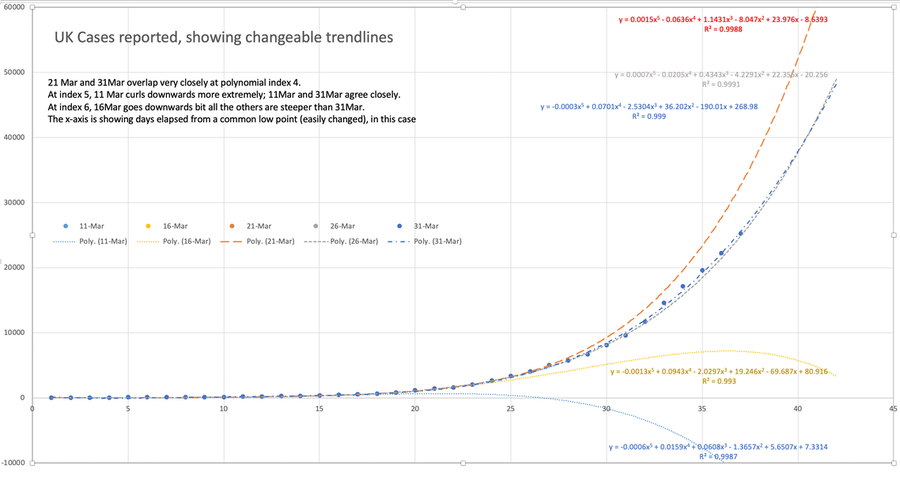
Here's a graph, new on 01April, showing the variability of prediction. All these curves are set at index five. The idea was to show the effect of each new data point on the trendlines; they wave around like live things, emphasising how prediction is a dangerous thing on which to build assumption. Building national capacity to cope with the possible is sufficient understanding, I think. Updated later in the month and not repeated in May.
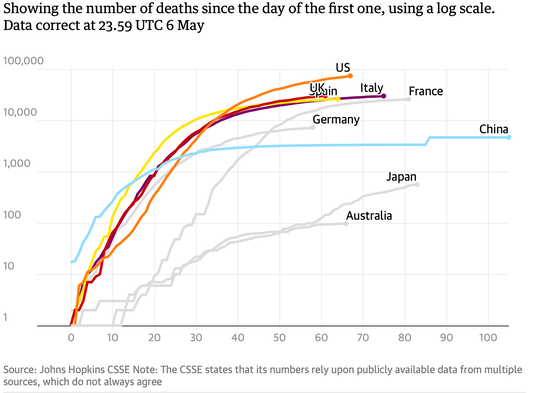
4th April: The apparent leap in the French figures is because of a problem that all reporting has. In this case, the deaths from nursing homes (i.e., not hospital) were delayed (not included until someone noticed). So the French numbers may well have correction, by which I mean that this jump might well be spread backwards as the date of death is correctly attributed. That jump moves the French trendline to nowhere helpful, but upwards. Edit: 30th April: today the UK did this too, including care homes and in the community (meaning at home, I think). What is significant, perhaps is the variability around the trendline, which we could call 'noise'.
No doubt this applies to other nations too. I saw comment this morning that the same applies to the British data; delivery of information is not uniform in terms of timeliness. Also commented is that death is pretty definite, unlike whether or not someone has had the disease. That doesn't recognise that what the death is attributed to is itself part of the problem. For example did someone die because of Covid-19 or simply with it? I remember wife No1 commenting on her work with old records, that it was quite apparent that on occasion the 'reason for death' given was a matter of expedience, that 'don't know' or 'haven't time' were unacceptable, so whatever was currently being blamed was the choice that no-one would argue with.
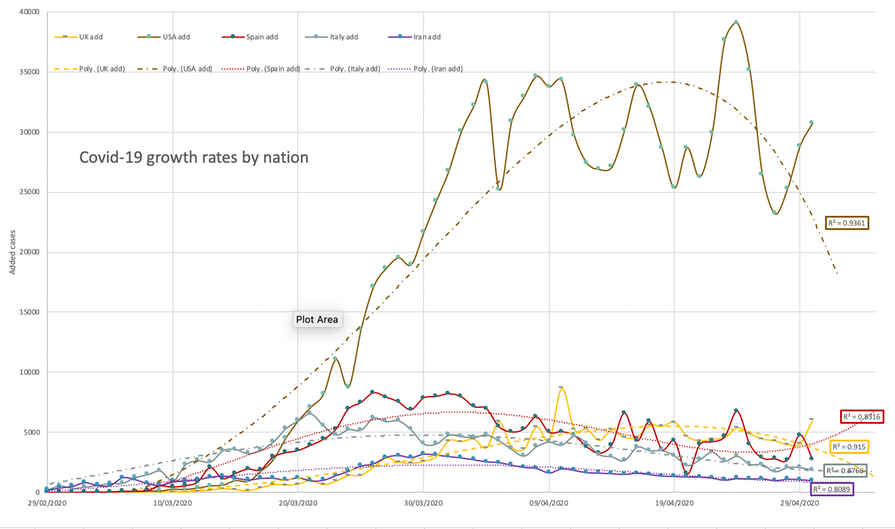
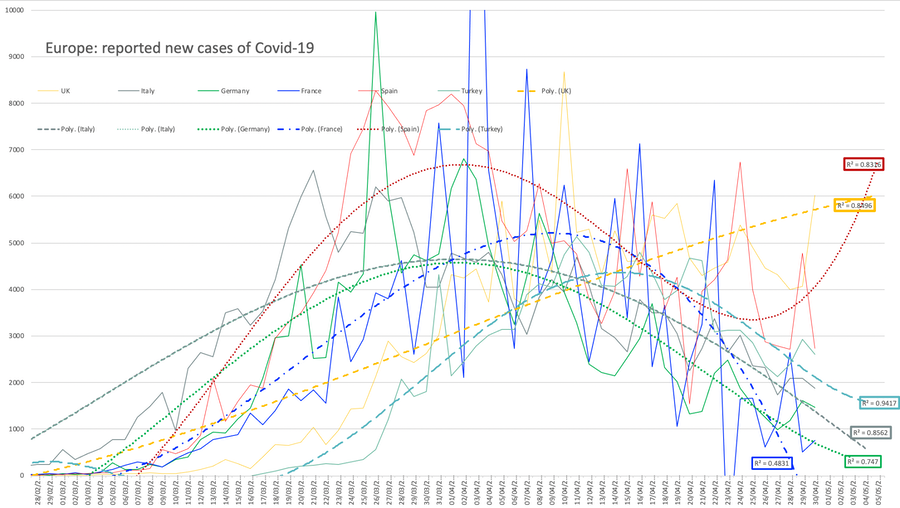
Trending downwards: Italy, perhaps Spain and Germany. Trending upwards: US, UK and France. Iran, too. Today the US is found to have been throwing its weight around so as to have more 'protection', something that will come back to bite them later in the year. Britain seems to be on the losing end of such tussles and I predict we will move the manufacturing ability to be within these shores, as we are showing can be done, by redirecting some of the relatively small but very inventive manufacturers. So, while there is a shortage of the materials for the sort of testing we'd like to do, and a shortage of protective equipment, we have the technology with which to make such stuff, once the message has gone out. I think we will have some sensible legislation that allows us to move to such a footing more easily in the future — what I think has happened, is that those in need have commissioned material to be made; the necessity of invention, coupled with the available capacity from businesses being deprived of their 'normal' work. So because of need we have businesses such as clothing manufacture becoming key.
5th/6th April There is a weekend effect reflected in the reporting. So the US shows relatively fewer new cases, which moves their second difference trendline downwards. Britain needs to show some tempering of the upward trend. All the idiots who think the restrictions apply only to other people only add restrictions to those who are already observing them. I wish there was a comeuppance available. Yesterday the PM was admitted to hospital, not getting noticeably better. If Raab has to stand in (confirmed late on the 6th, as BoJo is moved to ICU).
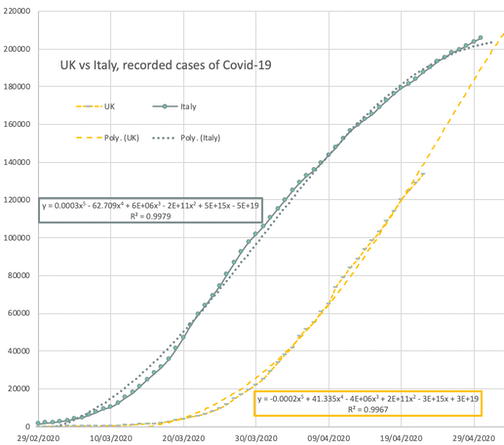
8/9th April I am bothered by the French figures, which do not show a tendency to peak, though the second difference curve looks far better. I am bothered how similar the UK cases and deaths are to the Italian curve; I had hoped our figures would remain consistently below as a week ago (end of March) suggested. The second difference curve suggests that the UK is not yet improving while the case count graph says that France and the US have real problems as yet. Germany seems to have peaked, Iran possibly so too. I noticed that petrol pump prices have dropped a lot, but one has so little use for fuel at the moment. Social distancing is seen to be observed in Blackpool, but, as one of my neighbours remarked, the pond life is absent. In my pond that is also true, no frogs this year.
10th April At last we have the French case curve predicted to peak. Tomorrow for the new trend line in the 'changeable' graph, nearest the foot of the page. The second difference in the US curve peaks at last, which suggests another week to ten days before that shows in the other graphs. We need to recognise that there are many cases out in the community not being reported, and many deaths are delayed by circumstance. Generally I have not included deaths in my graphs. I have several reasons, one of which is that deaths are a long way behind cases, by two or three weeks; thus deaths serve as support for the evidence suggested much earlier by the case count, however flawed that counting is. Provided the counting remains consistent (the horizon for what it is that is counted stays as it is), then those numbers are relatively reliable, wrong by a consistent degree.
Lockdown began in the UK on March23rd. Or perhaps Friday 20th. I say the peak represents in some sense, halfway. Though many will say this not a symmetrical curve, I think we should go back to look at the Chinese case curve, which is only a little skewed. So if peak was to be at the end of April, which is what happened we'd be looking to lift restrictions (not doing it, thinking about it) in the second week of June. Not May, June. No doubt we will watch our Europeans neighbours closely; Italy and Germany are around three weeks ahead. London remains around a week ahead of the rest of the nation, yet since any lifting will be blanket, they'll have to wait until the new case count is consistently low elsewhere. Density of population is seen to lead to breach of behaviour rules, so this could easily degenerate into bad and worse performance. I fear that many are listening for 'peak' thinking that means 'end', which it patently is not. It would not take much in terms of breach too soon to cause a flare-up and reaction to that could easily delay the end of lockdown by a month. We need to watch our neighbours and listen to them with care. DJS 20200410
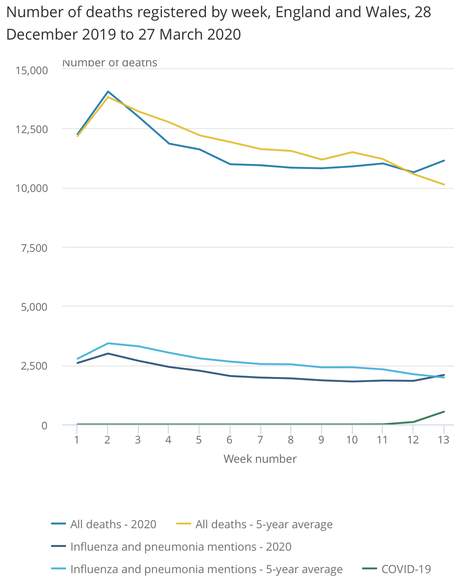
13th April A vigorous discussion at home caused us to look up 'normal' death rates, which are published by the week in the UK. 2020's first 13 weeks (England & Wales, to the end of March) shows that deaths would normally be in the region of 11,000 per week and that 2020 is well below the five-year average, maybe even significantly so. This rather puts the current issues into perspective. Yes, Covid-19 is killing people and some of these same people, perhaps many, would have been expected to die anyway this quarter. So we're right to make a fuss about those we wouldn't have expected to die, but at the same time we can see that the gap between the blue and yellow lines indicates that a lot of people have not died in Q1 of 2020, where we would have expected them to. Around 4,000 of them, by my estimate. Isn't that weird? Mind, 4,000 might well be within the expected variability from year to year. Edit around 1st May, excess deaths won't be known for a long time. A visible excess appeared in the last week of April.
Increasing evidence in the numbers suggests we (the UK as a whole) have a sloppy grip upon lockdown, that we could be and should be doing better than this. I suspect too many have decided that whatever is going on does not apply to them, evidenced by the ease with which people find others misbehaving and able to be photographed. Some of those photographs cause one to wonder at the photographer—what they were doing at the time, whether they should be tarred with the same brush, but that is a risk every whistleblower takes even when they evidence their own position. We need another week's figures to be sure, but as of today it looks as though our figures might become worse than Italy's. Yes, these numbers are people and every death is mourned; from a national viewpoint, I would hope that all people are equal, or more nearly so.
18th/19th April France has changed its figures for April, having discovered, they say, some double counting. Peaking seems to have occurred almost everywhere. I do not understand how that could be, so I am expecting secondary outbreaks to occur, just as I am expecting the clamour for lifting of restrictions to become steadily louder. It seems to me obvious that peak is halfway or less through the lockdown phase, which would leave Britain in lockdown to late June. I am fairly sure that any lifting of restriction before then will cause a second outbreak. The one thing that would change that opinion is if widespread antibody testing shows that very many of us have indeed 'had it', such that antibodies are well spread through the population. To ascertain that is so we need very definite antibody test results — we have to be able to trust those results enough to lift lockdown even a little, because that will be like lock gates, hard to have only at a trickle, and a bad enough trickle when the gates are 'closed'. We are not yet in a position to test large numbers. Germany's position, thanks to having a prodigious testing regime, is quite different; most obviously, they have low deaths per case discovered. I think we will have national-level consequences in the wash-up phase. It is now clear that Britain screwed up at an early point, probably missing an opportunity to continue the testing that began in March. Germany's figures (and S. Korea and NZ among others) demonstrate that. Conflicting advice, perhaps, but this is going to come back and haunt. We still have a Blame culture, not a Learning culture. Yet it seems to me that each of us had the same opportunity to be aware and to act accordingly. So perhaps the nanny state is partly to blame; "It's not my fault you didn't take action on my behalf". I could wish that we ended up being a good deal more accepting of being responsible for ourselves, just not at the level that the US takes this. I think I want both the state looking after us and us taking responsibility for our actions — or their lack.
22nd April Declaration from the Downing Street briefing (an almost compulsory tv session) said yesterday that they think peak may have been reached. This comes from comparing like figures (i.e., consistent, from a single source). The ONS figures disagree in number but not in trend. The delay between action (lockdown) and deaths of around three weeks is now visible, evident and understood by many more than a month ago. That does nothing to abate the clamour for lifting of restrictions. We heard a decent explanation of presymptomatic and asymptomatic cases both being infectious, but not as infectious as someone with the symptoms, who 'sheds virus' in much bigger volume. So we would not be surprised to find that many people have antibodies (when we get to do that testing). Amazingly we have human testing of a vaccine starting tomorrow — that's doing in months what previously was best done in years. A vaccine, it seems to me, will be very useful for those at risk who have so far tested negative; longer term, to prevent re-infection of course. Huge fuss about access to PPE (personal protective equipment, not pensions nor that light subject at university), where what the press was failing to indicate was just how quickly it gets used up and is not re-used. Consumption is immense.
23rd April Now we wait to see just how very long restrictions will need to last. I don't think people have yet recognised that 'flattening the curve' equals 'make the whole thing take longer' (hey, that's a good thing; we lose far fewer people). The press noticed at last that there are a lot of indirect deaths, suddenly showing dramatically and quite significantly. Chris Whitty explained yesterday that we are looking at a year of restrictions (not a few weeks), though quite which restrictions might be lifted depends very much on quite how low R has fallen: it must be below unity, but the lower it goes the more flexibility we have in what we lift. We don't know yet how low that is and we need to recognise that the delay from action to visible result is of the order of 3-6 weeks (3 for case count, 6 for deaths). What we cannot afford is a second wave and I think (listening between the words) we might well see a resurgence somewhere (not the UK) over the next month — plus the reaction to that. Meanwhile, NZ looks absolutely brilliant as a place to live.
27th April Turkey's figures are growing. I'm wondering whether I should take the US off the 'Europe plus' graph and add Turkey instead. Done 3rd May. NZ declares the spread halted, for now and moves lockdown from 'level 4' to 3, with schools opening up to Y10 on Tuesday. Very impressive, but perhaps this emphasises the benefit of moving early enough —the delay from infection to symptom means that having sufficiently few cases to do 'test, track and trace' (as I've heard a lot of late) is of significant benefit. As last edit, the case level at which the UK can do that is currently out of reach. We have not yet found a suitably reliable antibody test, either (what says you've had it); it looks as though the at-risk groups could be in lockdown for a depressingly long time.
29th April The Italian case curve prediction changed its shape today, for the better. Right). Turkey and Russia are reporting large numbers, while one should recognise that European Russia, west of the Urals, is 112 million where Germany is 80, followed by France and the UK with very similar populations (dispute this? Try comparing different sites). Be aware that figures breaking down the UK into separate countries ought to be telling you the % population of the UK: England 84%, Scotland 8%, Wales 5%, N. Ireland 3%. You might well argue we should all know that anyway. Arguments for devolution should (therefore) look to partition England into chunks of population between 3 and 10%, shouldn't they? So at least eight regions of England, perhaps twice that. And then we can move to recognising London as a different place, possibly even as Inner London and one or two Other Londons.
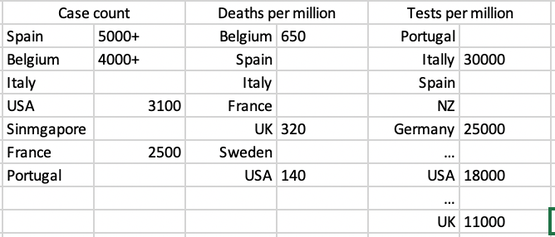
I had a look at counting per million of population, restricting to large enough countries and rounding any quoted numbers off to 2 sig figures. Table adjacent; apologies for it being a bit scrappy.
As yet it is difficult to test if you've had it with sufficient certainty but the test count is muddled by what tests are being done. The UK is mostly doing antigen tests (have you got it) and the capacity to offer that is expanding rapidly. Whether it is understood what it is that the test does, I still doubt, but that is to do with people's inability to listen with precision, a direct effect of doing muddy thinking. We really do need to fix that general problem.
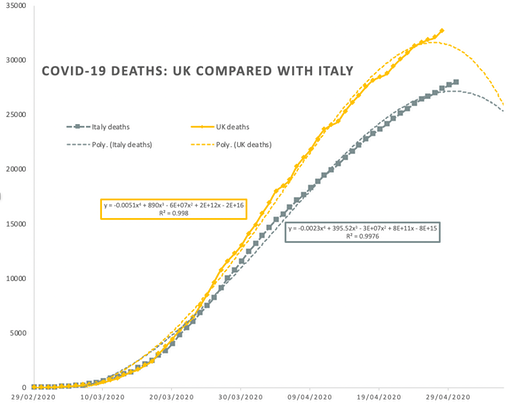
30th April British deaths revised throughout to reflect care home deaths, moving the comparison with Italy quite a bit to the left and steeper. At the moment it looks as though the UK could have the worst per capita death figures. I'm sure the press will seek a blame cause and it won't be 'us, the people', but 'them, the government', though we collectively took as little notice as we could. We cannot yet be sure that peak is reached. I continue to predict silly behaviour as soon as the downward trend is publicly recognised. Already 'past the peak' has meant some businesses reopening. I am bothered by the connection, not the events themselves.
DJS 20200513
A good article from the last day of April in the Guardian covers the counting problem rather well. https://www.theguardian.com/commentisfree/2020/apr/30/coronavirus-deaths-how-does-britain-compare-with-other-countries
Article on US testing and reporting: https://www.theatlantic.com/health/archive/2020/03/how-many-americans-have-been-tested-coronavirus/607597/?utm_source=newsletter&utm_medium=email&utm_campaign=atlantic-daily-newsletter&utm_content=20201228&silverid=NTE3MDgxNDgxMDUyS0 What a mess. March 2020.
I have wondered (lonely, as a cloud) if our journey through lockdown can be defined by what we deem funny at the time. Here are some suggestions, sourced most from memory and Esquire. I am touched at what it is that was funny then and not funny later.
March 10th Down south they're worried about the work they'll miss with a fortnight of isolation, up north we're going round licking door handles hoping for two weeks off.
March 15th
Me: Boss, I can't come in today, I have a wee cough
Boss: I'll give you a week off then
Me: Two wee coughs??? I can't afford to miss that much work!
March 20th "We used to stand outside the court between sessions. One game to relieve boredom was to bet on whether the next guy to leave the gents had washed his hands. That's no fun any more."
March 30th “A year from now, you’ll all be laughing about this virus." Pause. "Not all of you, obviously.”
April 5th I watched a really bad movie last night. Not only was everybody smoking, they weren't following the distancing rules!!
April 10th Last night, around eight o'clock, several royals were learning to clap.
April 15th Owain Wyn Evans, the weather guy. video link
April 20th A tweet: Ordered my 80 year old nan a rowing machine so she can stop being lazy and start making some damn money for the NHS
April 25th A tweet: Glad to know that 6 am walks full of existential dread can still be part of my lifestyle, just with a night of sleep behind me now

April 30th Found this, labelled Day 18 of lockdown: filled the dog with helium. Day 18, depending when you started, was April 28th-31st (ha!).

May the 4th be with you. Nights are so clear now you can see the crawldowns.
Related pages:
Essay 291 - Effects of an outbreak what it says, effects, but some description of what we have (and not)
Essay 293 - Covid-19 charts charts published daily reflecting concerns and issues.
Essay 295 Long-term Distancing
Coronavirus (Y10+) modelling problems
Epidemics more general theory
Infectious disease looking at the 2020 problem, particularly effects of the reproduction number changing.
Essay 298 Covid Consequences surprisingly prescient, considering when it was written.
Essay 304 Covid Disparities A report on the report, including what it doesn't say.
Essay 311 Covid in August This very page
Viruses are very small Worth reading, I think. (But I would, wouldn't I?)
Essay 318 Covid in October charts updated through November
Essay 328 Vaccine progress What it says on the tin.
Essay 332 Covid in January Lockdown 3 takes effect
Essay 337 Covid in February This very page.