 Given the attitude that says covid is somehow over, I think that what we have instead is an endemic disease added to a list of such things. Particularly I think covid will simply become part of the frequent reporting on respiratory diseases in the UK. In effect, since the nations are separated for health, this will often mean finding reports on only England.
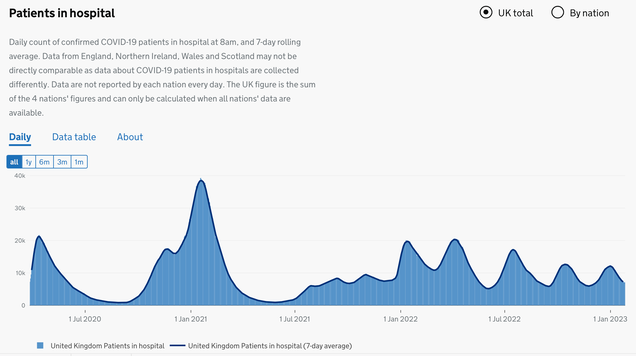
Through January we've had something like a million people (1.5% of the population)ill of covid at any one time and we continue to have 5-10 thousand people in hospital identified with covid. This is non-trivial. Influenza figures sit at around 2% at this time of year and the collected respiratory disease count suggests that we are not a well nation. I am bothered by the repetitive nature of the surges in numbers and, though this cycling might be entirely down to covid, it looks remarkable seasonal to me.
From here onwards I've written as if this may be the last such report.
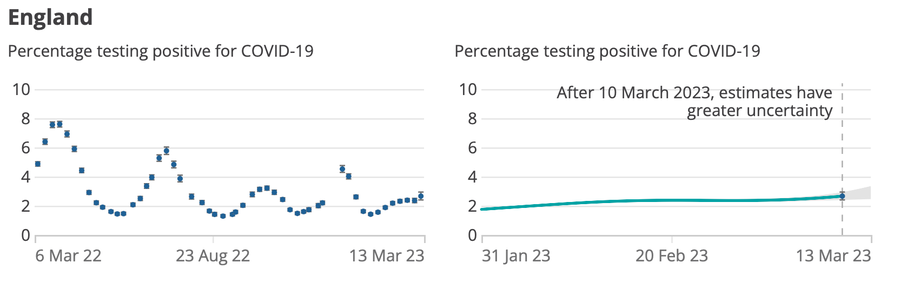
The ONS survey for Week 5 of 2023 says prevalence is 1in 65 (Wales), 1 in 70 (Eng & Sco) and 1in 80 (NI). That is around 1.5% of all of us are estimated to test positive for covid-19. Again the ONS has proved jolly good at this estimation.
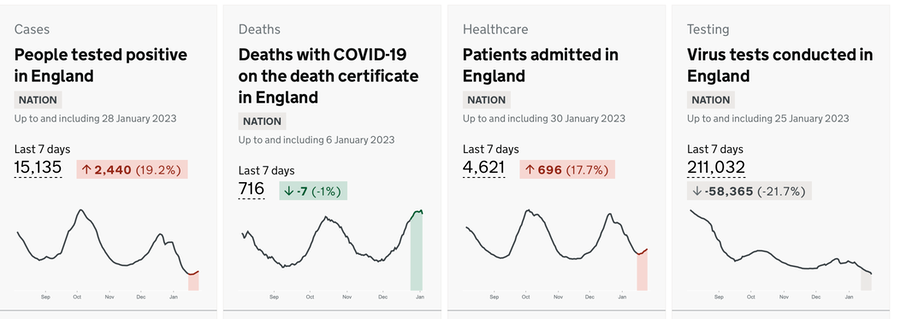
The coronavirus report for February is above. The link should offer you sight of the latest report.
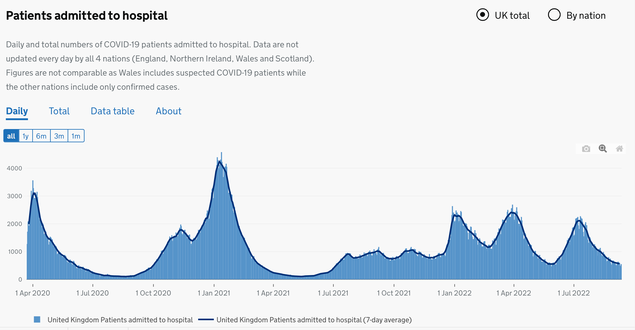
From a different page in the same site we can see hospitalisation: the latest figures showing 600 patients (with covid) recently admitted and 7000 using beds, which is around 10% of all beds used, already near the practical capacity of 80,000. We have about 130,000 beds in total, proportionately far less than Europe (half of the mean) and this number has fallen, even as the population itself grows. See report.
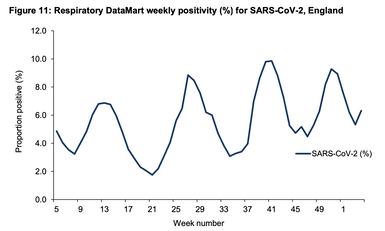
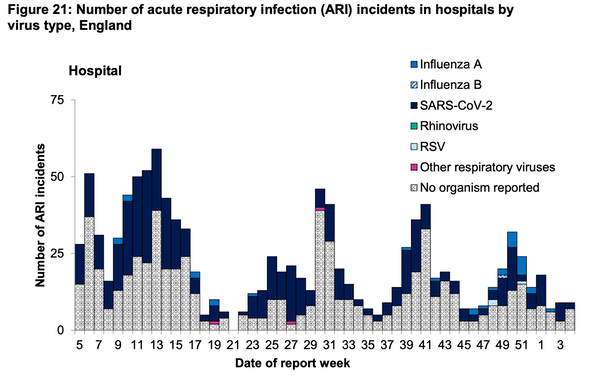
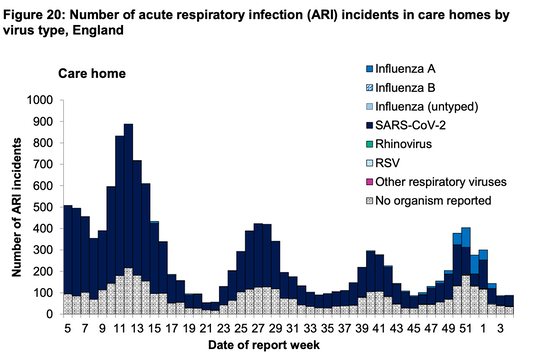
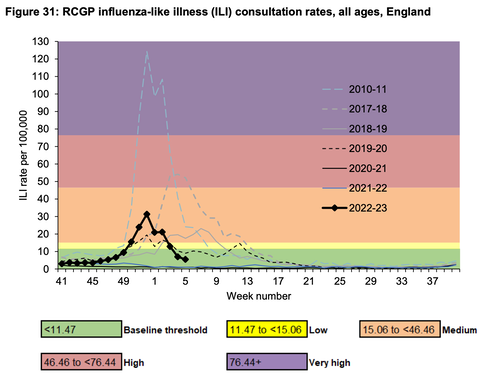
The report I wanted to have found earlier is now from the UK Health Security Agency, the UKHSA. looking at the Week 5 report (to the start of February) I copy figures 11, 20 and 21.
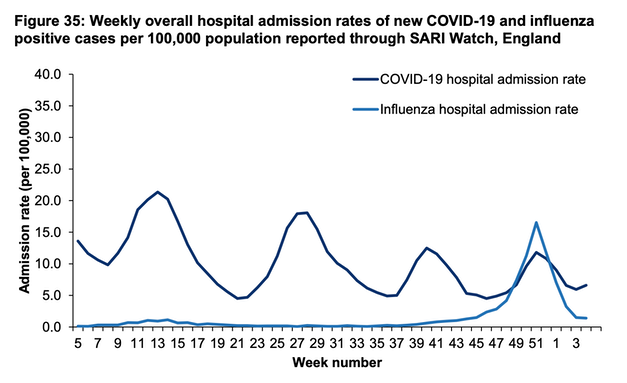
I notice that these graphs are exhibiting four cycles a year, so I'll call this seasonal. It may be that covid is cycling and so masking the ways in which the other respiratory diseases change. My observation was that many of the graphs (and there are many) exhibited this property. I didn't think too hard about this. Table 35 may explain that covid and influenza behave differently.
Reading David Speigelhalter (again) I conclude that the waves occur because herd immunity (derided in 2020, made possible by vaccines) is breached and then restored. Die-back occurs (obviously) when the number of people who could catch the latest infection is sufficiently low. The survival of each new variant depends upon its ability to infect and therefore reproduce. People with existing immunity are less likely to be re-infected and less likely to be heavily infected. This is why viruses tend to weaken with time; consequently the transmission can be expected to rise (oh, dear) but the severity to fall (oh, good). But, if we have an awful lot of people acting as hosts for possible new variants, that brings the moment of the next variant of concern ever closer. This is not something we might eradicate (like polio or smallpox) but something we mitigate and manage, like colds and 'flu.
DJS 20230208
[1] https://coronavirus.data.gov.uk/ dashboard for the date, 202208... The link is going to be more up to date than my screen dump.
[2] Go to Covid dashboard @ Guardian for the current position. Last update 20220520.
[2a] update page (a possible example of link rot) https://www.theguardian.com/world/2022/jun/01/covid-19-uk-cases-deaths-vaccinations-latest-numbers-coronavirus-national-data
[3] ONS: https://www.ons.gov.uk/
[4] https://coronavirus.data.gov.uk/details/healthcare (sample below only runs to 20220907; update expected.)
[5] Weekly Admissions and Beds 11 August 2022 (XLSX, 1.9MB)
[6] https://www.worldometers.info/coronavirus/#countries (UK line)
[7] covid-uk-coronavirus-cases-deaths-and-vaccinations-today
[8] UKHSA report in chart form. I am disappointed that I had not found this source sooner. This would be (would have been) good to have shared in a school assembly.
THis pair of charts, added in May, are from the last ONS report, dated 20230324