
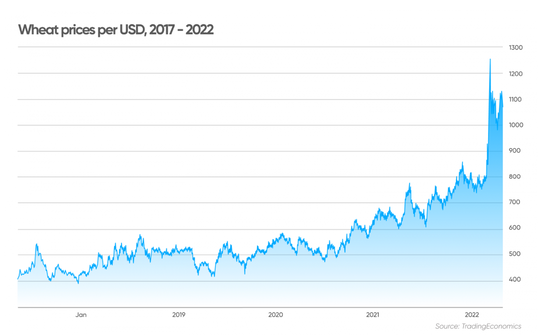
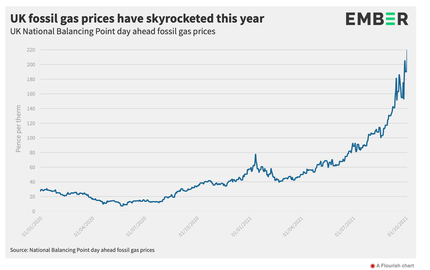
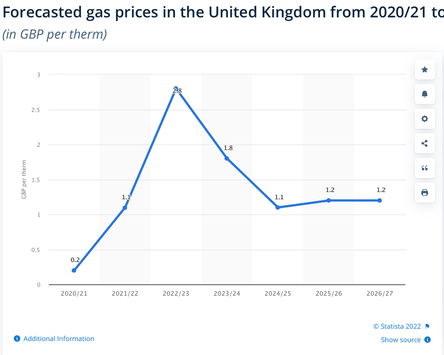
One would think that spring would reduce energy demand significantly. But the leap in gas prices is having a steady knock-on effect, e.g., UK inflation at 7% source, and rising to 10% by the end of the year [6]. Increased fuel costs nudges virtually everything upwards; loss of Ukraine (and Russian) wheat is going to have another significant effect, (see list); Russia and the Ukraine produced (2020) 111 of the global 760 million tonnes, not quite 15% of the whole. The EU produces a bit under 17% and only China grows more, still under 18%. So I think we should expect inflation on fuel and food to continue upwards. Wheat price forecast. Gas price forecast. That UK prediction looks like a multiplier of five or six on 2020 gas prices, which not only would make gas more expensive than electricity, but that too would rise in price. This is not at all straightforward; gas prices are quoted in pence per therm, currently passing 200 and at a mean for 2022 of 153, while electricity is quoted in price per MWh and the 2022 price is £150. 100 therms equate to 2.93 MWh, so would cost around £153 and that would be £52 per MWh. But we make quite a lot (about a third) of electricity from gas (see [4]), which is why the prediction for electricity price in 2022 is three times what it was in 2020. So we might as well accept that all energy is going to leap by a multiplier of three or more and that, while the government will take actions to slow these changes down, in the end the multiplier will be more like four, say in 2023 (and ignoring the inflation that this brings).
Bearing all that in mind, the incentive to Insulate Britain ought to be significant. But of course we have, like the Ukraine situation, a lot of hand-wringing and precious little ability to do anything very much about matters. At an individual and personal level this changes how one might spend and I have often pointed to the national spend on entertainment (broadband, streaming, phones and tvs) so that I expect there will be a reduction in that as the same money moves to buy food and energy.
As ever, those with capital are in a position to make preventative moves, such as additional insulation. In our individual case, I'm afraid we'd be better off changing house thanks to the severe limitations caused by living in a conservation area.
DJS 20220428 (ish)
[1] https://www.ons.gov.uk/economy/inflationandpriceindices/bulletins/consumerpriceinflation/march2022
[2] https://worldpopulationreview.com/country-rankings/wheat-production-by-country
[3] https://www.statista.com/statistics/374970/united-kingdom-uk-gas-price-forecast/
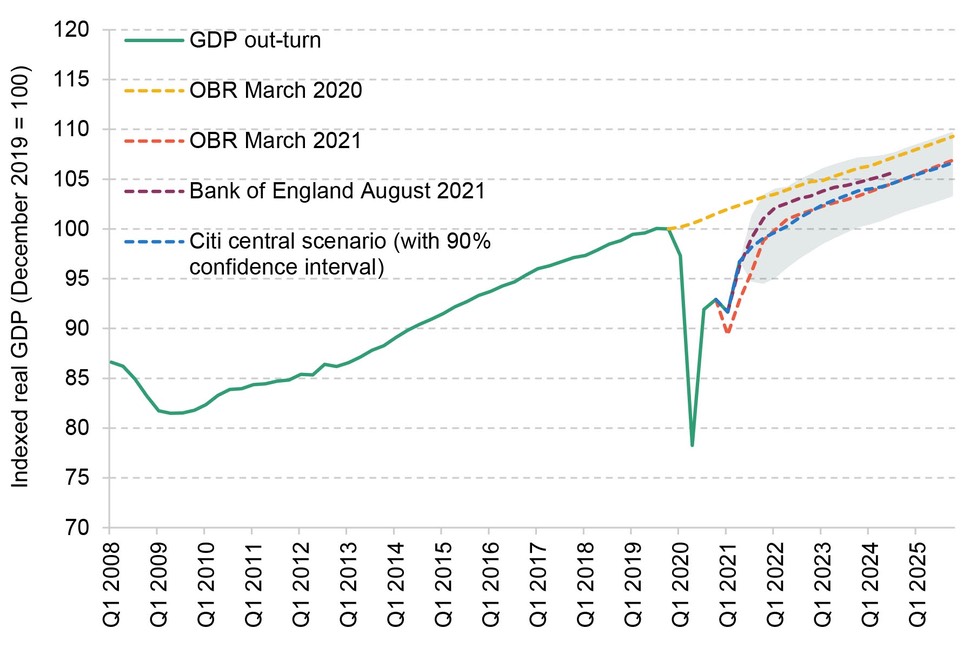
[5] https://ifs.org.uk/publications/15691?gclid=Cj0KCQjwg_iTBhDrARIsAD3Ib5gicCfcqG4un6QIr4EWHvMDouBi1XEa4FU_dsqbH-ff88OcLxKFTjIaAneYEALw_wcB Quite fascinating. The UK economy is in the midst of a sharp – but incomplete and wildly imbalanced – recovery. Mid-2021 the prediction was under 5% inflation April 2022. Yet we're at 7%.
[6] https://www.bankofengland.co.uk/-/media/boe/files/monetary-policy-report/2022/may/monetary-policy-report-may-2022.pdf Says 10% in Q4 is expected, and that we have 9% in Q2 (which is the current period). Surprisingly readable.
[7] https://www.ons.gov.uk/economy/inflationandpriceindices/articles/energypricesandtheireffectonhouseholds/2022-02-01 Take-homes:-
12% rise in the [..] energy price cap. The UK imports 50% of its gas; gas fuels a third of electricity generation. Oct2021, gas rose 17% and electricity 9% in price to consumers. Thus household service changes were the biggest contributor to the inflation rate, 5% at the end of 2021. The immediate consequences have bee increases in domestic energy, of food and of transport. This hits lower income families relatively harder.
Connecting EPC ratings with annual spend; 46% of UK housing is rated at C or higher and this half's median spend is £1057 per year. ForBand D (38% of low income households) this leaps to £1279, E £1667, F £2226, G £3071. This surely should direct where to send support spending. See DoBEIS Fuel poverty statistics. [8]
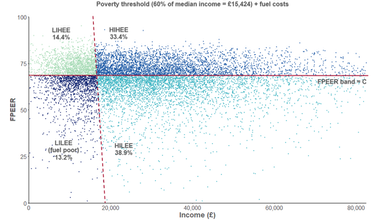
Fuel poverty is a measure of required fuel costs, not actual spend. A low income household is 60% of median income + (expected) fuel costs. For 2020, 27.6% of households were deemed as low income and 52% as low efficiency. Of low income households, 48% of these class as low energy efficiency, being in houses classed as D or worse.
UK 2020 median income is £25706. Poverty threshold is 60% of this £15424. This disagrees with the ONS, which says £30800. I suspect that the lower one is after deducting 'housing costs'. Disposable income is what is left after paying income tax and council tax; it includes benefits and pensions. Both these figures disagree with the DWP output, which says median household income was £28550 or £24850, depending whether you deduct housing costs. For 2021, the DWP figure for the median is 28080, making the poverty line £16848, which agrees with figures I found in other places, £16840 ±40. After housing costs, the DWP says the median is £24550-24600.
________________________________
This page was moved from Essay 384 to form essay 386, 20220512-4.
________________________________
If gas goes up by a factor of four and a third of electricity is made from gas, and if gas was (before the changes) a quarter of the electricity price for the same amount of energy, by what proportion does the electricity price rise? If you consume 3 parts of gas for 2 parts of electricity, how does will your energy costs change?
Let the 'before' figure for gas be x, so the 'before' price for electricity is 4x. The 'after' price for gas is 4x and the electricity cost goes up by a third of the gas increase, so by x. Thus the 'after' prices are gas 4x and electricity 5x.
For consumption cost, your 'before' figure was 1/5 ( 3x +2(4x)) = 11x/5 = 2.2x and your 'after' figure is 1/5 (3(4x) +2(5x) = 18x/5 =3.6x So your energy costs expect to rise by 3.6x-2.2x) / 2.2x = 14/22, which is by 64% of what they were.
________________________________
Are subsidies rubbish?
Subsidies make sense when used to correct so-called market imperfections; that is, when competitive, private markets fail to deliver socially desirable outcomes. For example, subsidies can encourage businesses to invest in research and development that benefits not only their firm, but the industry or society as well.
If we subsidise farmers, it is to allow food proces to be lower. If we subsidise higher education, it encourages more people to pursue that. If subsidies lower tax in a particular market, that is intended to, indirectly, encourage the market. Thus a subsidy could be used to encourage a change, such as from fossil fuel towards renewables. welfare payments and unemployment benefit can be considered as subsidy. Bailing out the banks post the 2008 crisis could be called a subsidy, where inaction would be (thought to be) the cause of more major costs, a general market failure.
There are views that see subsidies as bad, even when acted from good intent. This seems to particularly apply when the subsidy goes to a large business. It is not difficult to see a subsidy as creating an incentive for continuance of that subsidy, long after the need has elapsed. In a sense, the market adjusts to the new position and then resists change. The bigger the business the easier is the access to political ears and the longer the subsidy will persevere.
A subsidy is considered a failure if it fails to benefit the whole economy [11] A politician may well disagree with that if political or cultural goals re achieved. The average farmer made £28,300 in subsidies last year and £2,100 from agriculture. The average cereal farmer lost £9,500 on agriculture. [Times, Aug 2016, and fullfact.org] this is the price we pay (in recylced taxes) to have what we perceive as cheap food. If we were to juggle with these subsidies we could easily change the national diet by causing prices to move up and down.
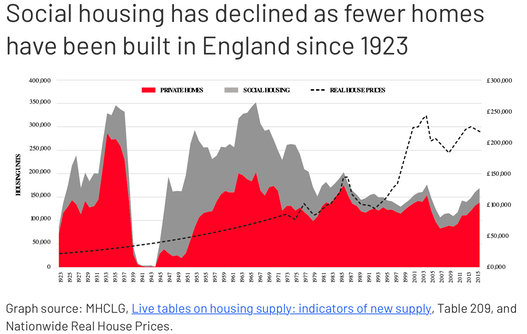
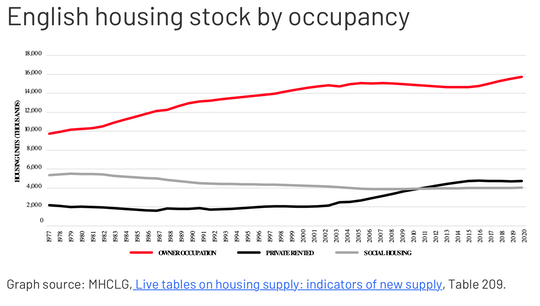
The HelpToBuy scheme purports to help first-time buyers enter the market. What has happened is that the houses sold at prices inflated by more than the subsidy, so they were not good value for money. the vast sum spent, some £29billion could (obviously) have been spent more effectively. The flagship policy of the Thatcher years sold off council housing (Right to Buy), which directly benefited the two milion or so tenants who bought below market value, but simultaneously removed all those houses from the subsidised housing pool. In 1980, a third of people lived in socially rented homes, at genuinely affordable below-market rents. That’s now fallen to 17%. Over the past 30 years, England has seen a net loss of 24,000 social homes every year on average. Another 29,000 social homes vanished alone through sales and demolitions. (chart from link). The shortage of subsidised housing pushes people into renting and the demand pushes the rents up, the occupancy rates up and the standards down; there is a sense in which the hunt for lower rent permits standards to fall, particularly for those people for whom social housing has always been intended. But we have far too little social housing and we have been losing it almost as fast as we build it. source [12] estimates there are 1.4 million fewer households in social housing than there were back in 1980. That is a misleading statement, implying that this is the size of the immediate need, that may also be true, but that is not what that difference indicates. the waiting list for social housing is not based on the same information as 1980 (and so it is difficult to give a sensible figure for comparison). Right to Buy continues to remove housing from the social housing stock (see gov.uk for figures,typically 10,000 units, I think), we have around 4,000 units demolished each year and we have a supply at around 50,000 units a year. What we have here is an echo-chamber effect; one source has pointed to that 1.4 million homes and other s have copied it without reading it thoroughly. Thus, depending on where you begin and which figurew you think make sense, the 'need' for housing is anything from 150 to 350 thousand houses a year any or all of whom need to be designated a social housing. What a confusion.
Oh, it gets worse. A 2019 report found that 42 per cent of homes sold under Right to Buy were privately let [13] Which rather implies abuse of the system that Right to Buy was supposed to be creating (which, the cynical might say, were intended to become Tory voters).
affordable housing is now defined as costing up to 80 per cent of market rent or market value in London [13]
What has pushed rents up is the way that Right to Buy (1980s) rubs up against Buy to Let (1996) . Housing benefit was meant to cover rent and cannot, since (2008, 2011) entitltement is based on the bottom 30 percent of the local rents. It became a 'bad' subsidy, as the market moved to a basis that assumed that subsidy was forthcoming, and so this marketisation meant that in a circular way, the benefit geareed the market and the market geared the benefit. This gearing (more or less) ceased in 2011, leaving a gap of around £200 per month for those on London Housing Allowance. The 2011 idea was to push benefits (as a total bill) downwards, but in practice it doubled between 2000 and 2020 [13, heavily paraphrased]. This number is large becasue many of those that had been in socail housing are now renting. See the GLA report at [14, read the key findings on page 6], some of which I quote here:-
In the five years since my previous report, at least 11,825 more homes sold through Right to Buy are being privately rented in London. That alone is more than seven times the number of homes built by local authorities in London in the same period (1,670).20
- In London there are more than 54,000 homes which were sold through Right to Buy now being privately let.
- This now represents 42% of former council homes in London, up from 36% in 2014. (Please see methodological note on page 13 for more details, but these percentages refer to the responses given by local authorities, and this does not necessarily reflect the total number of Right to Buy homes sold according to MHCLG data).
- In 2014, there was only one borough (Tower Hamlets) where more than half the council homes sold were then owned by private landlords. There are now at least three (Westminster, Harrow and Enfield, while Tower Hamlets was not able to provide figures on this occasion, but it is likely that it is still the case in that borough also). [...]
In order to meet need, many councils have bought back properties they had once sold. At least 1,630 of such homes have been bought back, some for meeting general needs, some as part of wider estate regeneration projects. [...]
Council housing stock in London continues to fall as Right to Buy remains. In the last five years, 15,859 council homes have been sold in London.25 Since 1998-99, when detailed annual statistics are available, 102,480 council homes were sold and only 3,000 new ones have been built.
So money has been provided by the state to build social housing, which is then sold at less than market value and subsequently is (has to be, to meet the desperate need) bought back at market value in a market that has grown faster than any inflation and often faster than other investments. That is giving moneyt to those who are, sometimes quite blatantly, profeteering from this opportunity. And why not, you might ask; this is the sort of loophole that we emply our representatives to make sure does not happen. Yet in our crumbling political society, one can't help wonder if this opprtiunity has been encouraged quietly; the advantaged seeking ever more advantage, while the headline announcement was more nearly the opposite. Looking at that same situation slightly differently we might say that what was a subsidy of council housing aimed at low-income families has become subsidy for low income tenants in privately rented accommodation. One consequence is a general exodus from London, seeking sites with lower rent. That only moves the London problem outwards and in turn makes the Buy to Rent idea profitable all over again. Can a finger be pointed at this in parallel to the bank crash in 2008, just becasue what was happening here parallel the housing activity in the US? The consequence of the quantitative easing was to push property values up everywhere, but especially at the top end of the market. Since we have had similar action during the pandemic, we might expect such change to recur (or reoccur). But, while the top end rises, this generally nmeans that at the other end, the differences become even worse. And, becasue this is rental, not council housing, the housing situation itself is precarious. Precarity in enmployment and in housing is a very bad combination.
[10] https://www.imf.org/Publications/fandd/issues/2018/09/what-are-subsidies-basics
[11] https://www.investopedia.com/terms/s/subsidy.asp
[12] https://www.theguardian.com/commentisfree/2022/jan/25/george-osbornes-help-to-buy-scheme-disaster-housing-market which is a summary of a House of Lords report.
[13] https://www.ft.com/content/3fbd23e9-1330-4514-a849-5a0d7577d167 which I was able to read, unusually.
[14] https://www.london.gov.uk/node/49494 leading to https://www.london.gov.uk/sites/default/files/rtb_report_feb_update.pdf
DJS 20220527