
The unit for measuring carbon dioxide within climate change discussions is the gigatonne. Another unit is ppm, parts per million. In 2019 the measured level of atmospheric CO₂ was 412 ppm and you can see a reading today for Mauna Lua observatory on Hawaii, at https://www.co2.earth/daily-co2. The day I looked, the site said that the change across the last year was +1.86ppm.
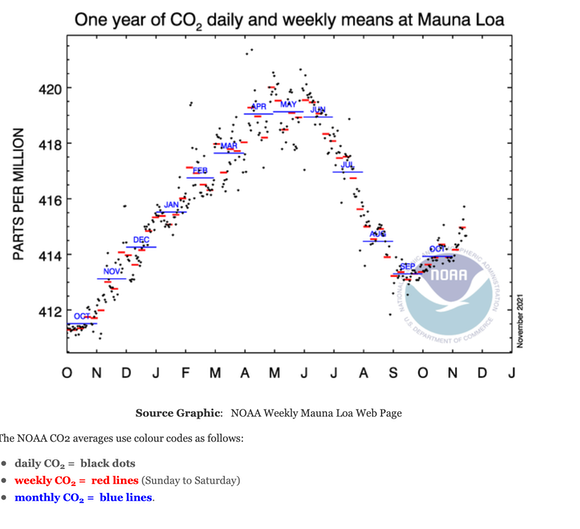
The graph I have inserted shows that CO₂ levels oscillate across the year so any short-term change is going to be unhelpful, while comparing with values for the same date in different years will be more useful but will still have quite a high variance, so look at the blue values, the monthly CO₂ values.
From a different page on the same site, I found In December 2020, the Global Carbon Project published its Global Carbon Budget 2020 which concluded:
- The global average concentration of CO2 in the atmosphere increased from about 277 parts per million (ppm) in 1750 to 410 ppm in 2019 (up 48%)
- In 2019, global CO2 emissions from fossil fuels were 36.4 Gt, 61% over 1990
- In 2020, global CO2 emissions from fossil fuels were projected to be 34.1 Gt, about 7% lower than 2019.
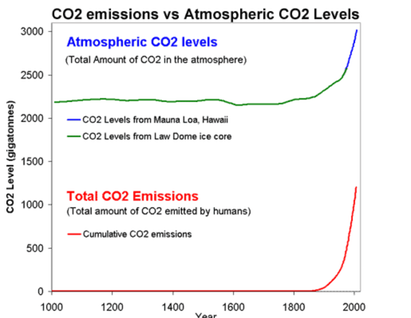
Let us assume then that our target for pre-industrial levels of pollution is to return to 277 ppm, the 1750 measure, which was much the same in 1850. The unit ppm, parts per million, may sometimes be written as ppmv, parts per million by volume. I'll tell you that 1 tonne of carbon is in 3.66 tonnes of CO₂ . Atomic weights of carbon and oxygen are 12 and 16 so 12/44ths of a tonne of CO₂ is carbon and the reciprocal says 3.6667 tones of CO₂ contain a tonne of carbon. 1 ppm by volume of atmospheric CO₂ is 2.13GtC ( I found this quoted in many places, but explaining how that is arrived at required other numbers to be accepted without good explanation, so just assume this number is considered as agreed). A gigatonne is also a peta gramme. Diagram to right; Figure 1: CO2 levels (Green Line - Law Dome, East Antarctica and Blue line - Mauna Loa, Hawaii) and Cumulative CO2 emissions in gigatonnes of CO2 (Red Line - CDIAC).
Q1. Convert 1ppm into tonnes of atmospheric CO₂.
Q2. We can see that these two curves are similar, but that correlation does not mean necessarily that there is causation. Can you point to a different measure that might show a corrrelation?
Q3. Show that a gigatonne is also a peta gramme.
Q4. We have gone form 277 ppm to 414ppm between 1850 and 2020. How many gigatonnes of atmospheric CO₂ has man added to the atmosphere? Show that this is 292 petagrammes of carbon.
Q5. According to Houghton and Hackler, land-use changes from 1850-2000 resulted in a net transfer of 154 PgC to the atmosphere. During that same period, 282 PgC were released bycombustion of fossil fuels, and 5.5 additional PgC were released to the atmosphere from cement manufacture. This adds up to 154 + 282 + 5.5 = 441.5 PgC, of which 282/444.1 = 64% is due to fossil-fuel combustion. Atmospheric CO2 concentrations rose from 288 ppmv in 1850 to 369.5 ppmv in 2000, for an increase of 81.5 ppmv, or 174 PgC. In other words, about 40% (174/441.5) of the additional carbon has remained in the atmosphere, while the remaining 60% has been transferred to the oceans and terrestrial biosphere. The 369.5 ppmv of carbon in the atmosphere, in the form of CO2, translates into 787 PgC, of which 174 PgC has been added since 1850. From the above, we see that 64% of that 174 PgC, or 111 PgC, can be attributed to fossil-fuel combustion. This represents about 14% (111/787) of the carbon in the atmosphere in the form of CO2. Source.
Assuming this to be correct, use your answer from Q4 to estimate how much of the additional carbon has rremained in the atmosphere. This is reworking the paragraph above for 2020 figures rather than 2000. Assume for now that we have continued to have 64% of the increase from burning fossil fuel.
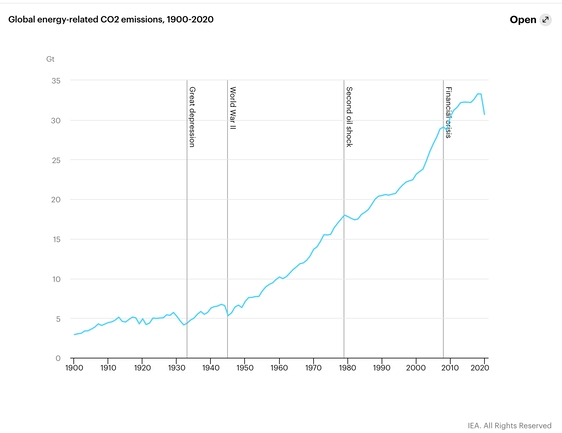
Q6. To the right is a chart taken from https://www.iea.org/reports/global-energy-review-2020/global-energy-and-co2-emissions-in-2020. I read the 2000 figure as 23 GtCO₂, which would be 49PgC, not remotely consistent with the 292 PgC from Q4. Elsewhere the report states that energy-related emissions dropped by nearly 3%, which also goes nowhere near explaining why 49 is such a small number. Here's a different sort of question: can you explain the apparent disagreement in the figures?
______________________________
There are several schemes under development to capture CO₂ when it is being generated from the burning of fuels. To date this has proved very expensive. DJS reference. One such pilot scheme is occurring at Drax power station, with has a bio-mass generator, basically burning wood pellets. The resulting gases include CO₂ is suitable concentrations to test out capture methods. Example description. https://www.drax.com/sustainability/carbon-emissions/towards-carbon-negative/
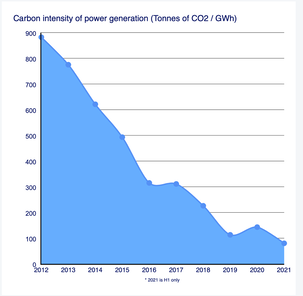
Q7. From the Drax site, if this chart is not enough, explain the term carbon intensity. Don't complain that this isn't maths, though you're right.
The description of BECCS looks extremely good. https://www.drax.com/about-us/our-projects/bioenergy-carbon-capture-use-and-storage-beccs/ Read also some of the criticism, such as here, https://www.fern.org/publications-insight/six-problems-with-beccs-57/?gclid=Cj0KCQiAys2MBhDOARIsAFf1D1cQjwoB-mgsjRrNp9fL2VlSUtUy76yPHK-J24G-BDIRK-GcOiIpDDUaAkDwEALw_wcB and here https://www.oneearth.org/beccs-no-time-for-false-saviours/ (and find some critics yourself to reference in answers).
The assumption behind BECCS is that because trees absorb carbon, if you burn them for energy and then capture and bury the emissions below ground, you achieve carbon dioxide removal from the atmosphere (CDR), or “negative emissions”.
Q8 Do any of the criticisms make you think that the Drax image of carbon capture is going to succeed? Do you think it is going to make economic sense, even if costs of the storage fall to 10% of current values? Do you agree with the assumption above in brown? Further, if you were offered work at Drax in this field, would you feel this job consistent with your beliefs?
Q9 and Q10 to come.....
From https://climate.nasa.gov/quizzes/quiz-co2/
Q9 In the 10,000 years before the Industrial Revolution in 1751, carbon dioxide levels rose less than 6 percent. Since then, they've risen by: a0 6%, b) 46% c) 62% This uses 2018 data. NASA says the answer is 46%
Q10 We produce more than 36 billion tons of carbon dioxide per year. Where does the majority of it end up? a)the air, b) the ocean c) the soil.
Q11 There a critical threshold for CO2 atmospheric levels in ppmv: a) 123 b)250 c) 400 d) 685
A1. 1 ppm by volume of atmospheric CO₂ is 2.13GtC. 3.6667 tones of CO₂ contain a tonne of carbon. So 1ppm = 2.13 x 3.6667 = 7.81 GtCO₂.
A2. Suggested answer: Look at the ratio of C13 to C12 in plants and in the atmosphere. If the increase in atmospheric CO₂ comes from fossil fuels, the C13/C12 ratio would be falling because the older sourcce has less C13 in it. This is true (paper)
A3. Gigatonne = billion tonnes = 1x10⁹ tonnes. 1 tonne = 1000kg = 1000² g = 10⁶ g. So a gigatonne is 10⁹x10⁶ = 10¹⁵g. Which is what the suffix peta means, 10¹⁵.
A4. 414-277 = 137ppmv. 137 x 7.81 = 1070 GtCO₂ (3sf). 137 x 2.13 = 292 PgC
A5. Replacing 292 for 174, 292/444.1 = 66% (2sf) has remained in the atmosphere. Replacing 369.5 with 414 changes the 787 figure to 882 (3sf), 414 x 2.13 = 882, of which 292 has been added since 1850. 64% of that 292 PgC is 187 PgC (3sf), which is (187/882) about 21% of the atmospheric carbon as CO₂.
A6. I can't, but I'm very receptive to your explanations. Do send me some.
A7. It's there on the chart; intensity is tonnes of CO₂ per gigawatt-hour. The chart suggests that Drax is doing rather well at making the combustion more efficient. Yet here disagrees and says it is CO₂ produced per dollar of GDP.
A8. I'll happily confess I find this very confusing. This is because the various arguments come from people whose livelihood seems to depend on persuading the reader that they are right. What we need is a disinterested reader (only in the sense that their employment does not depend on persuading you to agree) to explain what is and what is not true. Part of the underlying problem lies in that assumption, that burning trees and burying the emissions is 'negative emissions'. I am very suspicious. I also note that I can find no record of any carbon (from Drax) yet sequestered below ground. It seems to me to be a very expensive process; I think that I am persuaded that timber is a renewable resource in a very different way to that of wind or sunshine. I am not at all convince that burning timber is a good thing, though it is certainly beter than burning coal, oil or gas. For those of you copmplaining that 'this is not maths', therre is a sense it which what we do in maths is exactly this; we try to decide what is true. Where we think something is true, we build a model and see if that produces results we can use; when it doesn't we adjust or rejct the model, mostly by changing our assumptions. It is only after such paper modelling that we might go spend the sort of vast sums being spent at Drax on projects sich as this. So you know that a few people are convinced that this is a good thing, even if you disagree. To an extent, running the experiment to find out what was not known is also a good thing to do. The (mathematical) model persuades you that the expense is worthwhile.
A9 NASA says the answer is 46%. The 100% is the level of CO2 in the atmosphere in 1750, which I said was 277ppm, while the 2019 figure from Muana Loa was 412, which is a 49% rise. So the 2018 answer will be 46%.
A10 50% air, 30% ocean 20% remainder not certain
A11 I said 400 because it was a 1sf figure. This proved a correct assumption. We reached this (Muana Lua site) in 2006. I think this is false accounting, it was just a large round number that we passed. 'Critical value' means that passing the number has irreversible effects, not proven. site/cite. Another one.
Quizzes
https://climate.nasa.gov/climate_resources/21/quiz-carbon-dioxide/
https://www.energy.gov/articles/quiz-test-your-climate-change-iq intended for Americans. I scored badly.
https://www.earthday.org/the-climate-change-quiz/ I did well on this, but only because 'all of the above' is a gimme.
https://ig.ft.com/climate-change-quiz/ I did not do well, 8/12. Sea rise since 1900; % electricity from wind and solar worldwide (I know the UK figure); % change in emissions 2020 over 2019.
https://cleanet.org/clean/literacy/climate/quiz.html biased towards US answers, not global ones. Does not work well with Safari. Some answers disagree with other quizzes here and with media responses in the UK., Disagreeing would make a decent class discussion.