
I am far from sure where to place this. Perhaps I need a new space for those few who feel the need for 'more' maths, such as falls off the GCSE syllabus but which they might want in later life – without having to do an A-level in Maths. I've tried to pitch it at the younger end, for those with GCSE content, not A-level content.
Way back before calculators, we spent a lot of our lives doing arithmetic by hand. Lengthy multiplication was made speedier by accepting 3 or 4 significant figures and by 'using logs'. To do this, you looked up the numbers to be multiplied in one table, wrote these 'logs' down, added them, and then translated your answer using another table, antilogs, usually the next page in the book (the book of logs). Thus multiplication was reduced to addition. Similalrly division was reduced to subtraction.
How could this happen? There's not a lot of point in denying that calculators exist, so let's look at what your calculator can do.
First, let's confirm that you understand that 2²x2³ = 4x8 = 32 = 2⁵. This is because 2³ is the short form for writing 2x2x2 (three 2s multiplied together). So we can short cut this by adding the indices; 2²x2³ = 2x2 x 2x2x2 = 2x2x2x2x2 = 2⁵. We don't even need to show that this is 32.
Q0. Write down each these in the form xʸ: 3⁵⁶x3¹²; 2¹³x2⁶; 5⁷⁶ / 5⁵⁸; 10²³x10⁻¹²; 10²³ / 10⁻¹²
Q1. Can you find 10^0.30105 and 10^0.47712 ?
Q2. To what precision (sig. fig.) are these the integers two and three ? How does that compare with the precision of the logs I gave you?
Q3. Add 0.30105 and 0.47712 and find 10^(this total). Hopefully you have a result close to 6. If I identify 0.30105 as "the log of two in base 10", often simply 'log2', then we have shown that log2 +log3 = log (2x3) = log6. Some textbooks will use lg, and even shorter form of log, to indicate that we are understood to be working in base ten.
Now, why would you care about this at all? You've just demonstrated that your calculator does 10^(difficult index) quite easily. Answer, so that we can find the index itself, so that we can find the x in 10ˣ = N. or, for that matter , yˣ=N.
Suppose we're looking at some compound interest problems, for example in an environment where 10% interest might be available. Then if we have £1000 invested, this will grow by 10% every year, whch is multiplying by 1.1 whatever we had last year. So the amount of money we have in the fund is £1000 x 1.1 x 1.1 x 1.1 x.... = £1000 x 1.1ⁿ across n years.
So in a case like this (and in many financial situations) we might sensibly want to know how long it will be before our money reaches a target, like perhaps twice as much. Which means we would need to solve £1000 x 1.1ⁿ = £2000, or the equivalent problem, 1.1ⁿ = 2. We could mess around on our calculator (a polite term for this is 'decimal search') and soon see this is more than five years and less than ten.
Or we could look at the logs: 1.1ⁿ = 2 means n log (1.1) = log 2. so n = log2 / log1.1 = 7.27
It takes a little over seven years to double the money.
Q4. If interest was calculated every month instead, so 5% a year is 10/12 of a percent every month, show that seven years (84 months) is now sufficient time to double the money.
In a siimilar way, if you want to have a mortgage (so as to buy a house) you'll be paying money back for a long tiime, 20 to 30 years. The interest rate you pay is likley to be higher than any other investment you could have made, so that means that paying off the mortgage is a very effective way to 'save' money. I've explained mortgage payments in the finance section and gave an example:
Example: £50,000 for 25 years at 6%p.a. requires a payment of
£50000 x 0.005 x 1.005³⁰⁰ / (1.005³⁰⁰ -1) = £ 332.15 which is messy on a calculator and messier still if the '300' is the number you want to know. In practice, people in the business use paper tables or spreadsheets (one's they can't alter) - basically they look the answer up. But the important thing is to have a feel for the numbers well enough to recognise when an answer is wrong.
Logs will be useful almost every time there is growth and when that growth becomes rapid. So using a log scale on a graph can be a good way of seeing an underlying trend. Here's one I made in late 2021, trying to establish if the word 'exponential' really did apply to covid case growth; look particularly at the y-axis.
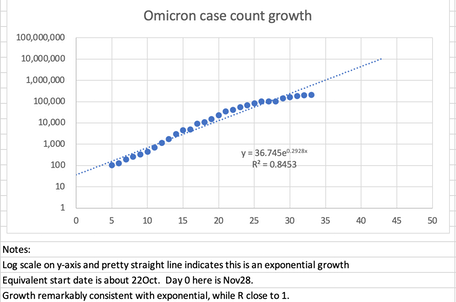
From a practical science point of view, if you have a graph that is strongly curved then redrawing the graph using a log scale will probably reduce the curvature enough for you to decide whether the 'new' result is ner enough to a straight line for you to be able to declare a relationship between the x and y variables. If you're playing with a spreadsheet, then trying to show a line of best fit (as above) will give further evidence. I've added (I did it out of habit) the R² number, whose closeness to 1 tells me a a lot about variance from the suggested best fit line. The theory for that is late on in a Statistics A-level, but here you only need to see that the square is positive and that close to one is 'a good fit'. Actually, that's about all the sixth former says, too.
In May of 2022 the media found a new scare to frighten us all with. This is monkey pox. I made a graph of the case count for the first few days, putting the day (date) on the x-axis and the case count on the y-axis. The line of best fit is an exponential whose formula is approximately 6y = e ˣ′⁴ and, for the student unfamiliar with the conversion, that curve can be expressed as
x = 4 ln (6y) where ln is the natural logarithm, a different (and usually adjacent) function button on your calculator.
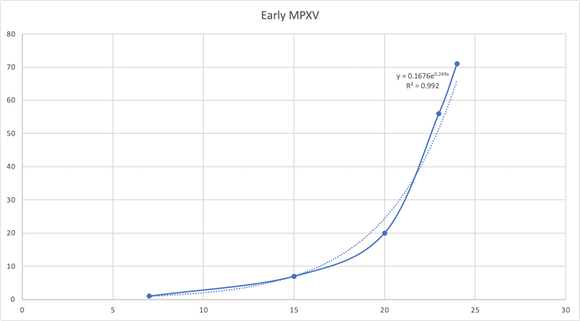
Q5. Use the formula x = 4 ln6y or 6y = e ˣ′⁴ to find y when x is 30 (thirty days).
Q6. Use the graph above to find the time it would take to double the case count.
Q7. By trying various values of y in the formula in Q5, see if you can improve that last answer.
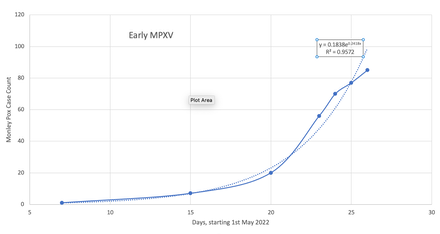
Q8. On May 26th, the graph is a little different, as shown. Predict the case count on the 30th. Make comments.
Q9. Do a little research to compare this position with the first four months of 2020, early in the covid pandemic.
DJS 20220520-5
A0. 3⁵⁶x3¹²= 3⁶⁸; 2¹³x2⁶= 2¹⁹; 5⁷⁶ / 5⁵⁸ = 5¹⁸; 10²³x10⁻¹²=10¹¹; 10²³ / 10⁻¹² = 10³⁵.
A1. 10^0.77817 = 6.00026 = 6 to 4sig.fig. Includes answer A3.
A2. 2 to 5 sig fig, 3 to 5 sig fig. The multiplication is not to 5 sig.fig.
A4. 1.008333333ⁿ = 2 => n = 83.5, which is now just less than seven years.
A5. 301. The other formula gives 293 so 300 is a 'good' answer, considering the precision available.
In practice, by day 30 there should have been mitigating action (intervention) to stem the the spread, so we should expect that the day 30 figure would be considearbly less. Whatever the result, this is a growth to continue observing; from the mathematical viewpoint, one is lookiing to improve the model, while from the public health viewpoint one is trying to change the situation by improved data (accurate, earlier, timely) and better (earlier, mostly) recognition of the disease.
A6. The result can be approximated from the graph. The points (17.5,10) and (20,20) lie on the curve, suggesting that the doubling tine is 2.5 days.
A7. Any answer between 2.5 and 3 is a decent attempt. Any answer between 2.75 and 2.8 is good. The simplest solution I can see is to look at y=1 and y=2. When y = 1, x = 4 ln6 = 7.167 and when y=2, x = 9.940, which suggests that the time to double y is the x-difference, 2.773. One way to do this (for thse who don't see a swift route to a solution) is to set up a table (I might use a spreadsheet) that explores values fitting the simpler equation.
A competent A-level candidate might proceed to say that at time T₀, y =N; from 6y = e ˣ′⁴ we could take logs and have ln(6N)=T₀/4 so T₀=4ln(6N). Later, at time T₁ the y value has doubled to 2N, so T₁=4ln(12N). We want to know T₁-T₀, which is 4 ln (12N) - 4 ln (6N) = 4 ln (12N/6N) = 4 ln2 = 2.773, which is consistent with the graph. [Subtraction of logs is division of the things being logged, remember?]
A8. If we were to call the last three points as lying on a straight line, the prediction for day 30 is now more like 115, not the 300 of Q5. Clearly intervention (expected vocabulary) has occurred, effective from the 24th onwards. This may be from improved counting; from better recognition of what is or is not monkey pox; from changes in behaviour leading to reduced spread. Perhaps, if you were in Public Health, you would look at the reaction time from first data capture to first evidence of intervention. We began recording monkey pox on Day 7 and within three weeks we have visibly affected growth so that it is no longer exponential.
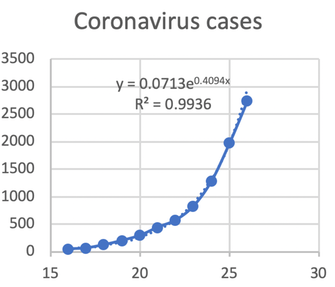
A9. For comparison, we identified the first three UK covid cases on 7th February 2020, having had plenty of warning that spread from elsewhere was likley to occur. It was 8th April, two months later, before ths case count stopped being exponential growth, by which time we had fifty thousand cases and, at the time, something like a 15-20% death rate. But we also know that we were counting, in that period, only the cases presenting themselves as very ill and the subsequent ONS data showed that the actual case count was three to five times greater, in line with a death rate of more like 3-5%. Since we went into lockdown on 23rd March, you would hope that the explosive growth would be affected by this public health intervention. So it proved. I looked at my own version of the information, such as here, which has links to the (many) pages I wrote on this topic. If you're interested in the maths, start here, which is where I copied my (own) graph from.
If you found this page helpful, you might read Coronavirus, which I wrote in the very early days of the pandemic. Oh, yes I did, January 2020.
