
 We appear to have moved to a position in which we pretend that Covid no longer exists. Yet people still go down with it, are absent from work because of it and remain not quite well for a long time afterwards.
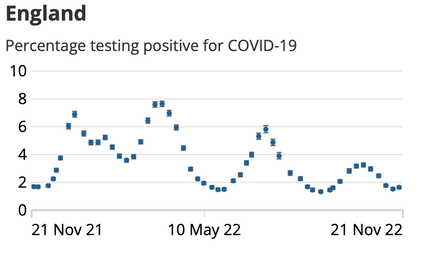
We remain at around the 4% mark in England and Wales, 5% in Scotland and 6% in Northern Ireland, on figures to the last week of July. That's 2.3 million Brits recognised as having Covid from the ONS survey. By the second week of September, ONS thinks we're at 1 in 70 in Eng, 1 in 95 in Wales and about 1 in 50 in the other two nations. That's from the report for the end of August. The report to mid-September says England 1 in 65, Wales 1 in 50, Scotland 1 in 45 and NI 1 in 80. But at the very same time as the report was published there are warning that there is a surge in case numbers. The report published 20221014 runs to Oct 3rd and reflects the increases one had expected, Eng 1:35, Wal 1:40, Sco 1:50 NI 1:40. That 1:35 represents a large number of people, around 1.5 million in England, 1.7 in the UK. By early November, 20221028 release E 1:30, W&S&NI 1:35. the 20221111 release says E&W 1:40, NI 1:40, S 1:50, all somewhat of an improvement. At 20221121: E&S 1:60, W 1:75, NI 1:65.
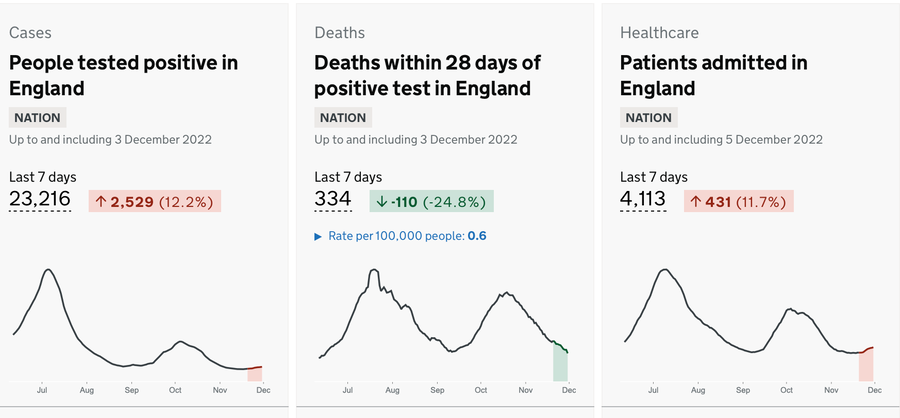
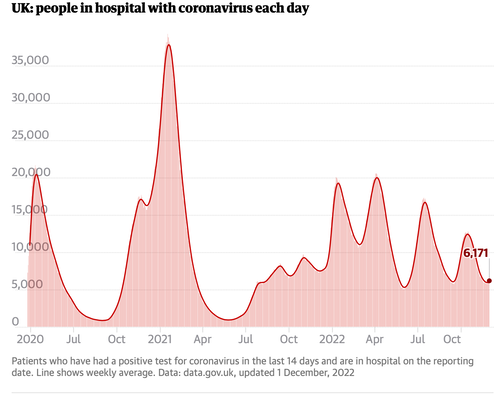
It seems to me that this is an issue which the general public may view as belonging in hospital. If so, I'm quite sure that this has horrid consequences for anyone working within the NHS. Having 11,000 cases in hospital with covid at the last measure is appalling and implies that covid is being spread within the NHS. Thus the staff are significantly at risk and this is going to do nothing good for staff recruitment or retention.
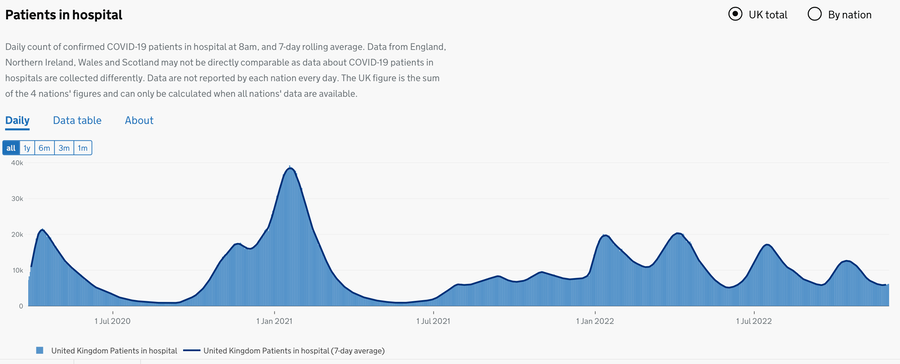
The charts with a slightly grey background are from here. [1]. Those with red vertical hatching are from [2], the Guardian. Blue instead of red is from [4]. Latest update by DJS was for information dated 20221003, available 14th.
I found the count of covid patients in hospital: on 220220730 there were 10,529 in England. [Source 4] after a recent peak of 13,840 on 20220717. I struggled to find how many patients there are in hospital irrespective of covid. The weekly covid admissions and beds publication Weekly Admissions and Beds 11 August 2022 (XLSX, 1.9MB) says that, on 17th July there were 73,189 non-covid patients (Adult G&A occupied) and 12,161 of the same but with covid. That's very close to a seventh of the total G&A beds with covid patients. Note how that doesn't entirely agree with the 13,840 figure, where the difference are not adults, or occupying a more extreme bed such as with a ventilator. For the 0730 date the figures are 9,468 and 77,034, making just under 11% of those G&A adult beds. For 20220809, 7,696 and 70,945, 9.8%. But that is still more than twice the percentage rate in the general English population.
DJS 20220813
[1] https://coronavirus.data.gov.uk/ dashboard for the date, 202208... The link is going to be more up to date than my screen dump.
[2] Go to Covid dashboard @ Guardian for the current position. Last update 20220520.
[2a] update page (a possible example of link rot) https://www.theguardian.com/world/2022/jun/01/covid-19-uk-cases-deaths-vaccinations-latest-numbers-coronavirus-national-data
[4] https://coronavirus.data.gov.uk/details/healthcare (sample below only runs to 20220907; update expected.)
[5] Weekly Admissions and Beds 11 August 2022 (XLSX, 1.9MB)
[6] https://www.worldometers.info/coronavirus/#countries (UK line)
This next chart is itself a link to its source page. They're a pig to change, but only becasue I have to turn OFF the links to update them (and I persist in forgetting to do just that).
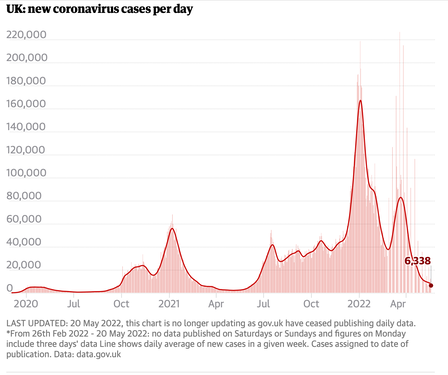
I looked at the worldometer dashboard, which says, 20221003, that the UK has 68.5 million people, has done 500 million tests, total cases per million is 345,600 and active cases right now is 121,815, which is 0.18% and so only refers to those who've notified, nothing like the numbers that the ONS estimate. We learned earlier that the ONS estimates are very good. The 1 in 65 figure for England suggests that at that time, mid September, we had a million cases, roughly eight times more than Worldometers is able to report.
DJS 20221003
last update 20221209
covid-uk-coronavirus-cases-deaths-and-vaccinations-today
Flu AND covid report. https://www.gov.uk/government/news/national-flu-and-covid-19-surveillance-reports-published
this to week 48 (out 20221208). For context and relative risk (perhaps); Swab positivity for flu* has increased further and is now at 14.3%; it remains highest in 15 to 44-year-olds at 24.3%. RSV overall swab positivity* decreased to 9.3% in week 48, with positivity in under 5-year-olds remaining high but decreasing to 26.8%. Laboratory reports of norovirus have remained lower than the 5-season average pre-COVID-19 (2014/2015 to 2018/2019) in recent weeks and were 26% lower in weeks 46 and 47. The number of reported enteric virus (EV) outbreaks also remained below pre-pandemic levels during weeks 46 and 47 with reports 55% lower than the 5-season average for the same 2-week period prior to the pandemic. Surveillance indicators suggest that, at a national level, COVID-19 activity has decreased in some indicators but was stable or increased slightly in others in week 48 of 2022. The COVID-19 hospital admission rate for week 48 was 5.45 per 100,000 population, a small increase from 4.51 in the previous week. Hospital admission rates for COVID-19 are highest in the North East, with a rate of 7.56 per 100,000 population.
UKHSA report in chart form. This shows influenza surging in the NW of England both A and B variants (A spreading elsewhere in a similar manner. RSV is surging (more than doubled in the last six weeks. Adenovirus is noticeably higher here than elsewhere. Parainfluenza (?) had a surge in London in the summer. Rhinovirus has been a problem in several regions (NW included); hMPV (?) is clearly jumping upwards everywhere.
I am disappointed that I had not found this source sooner. This would be (would have been) good to have shared in a school assembly.
Summary article applying to England. https://theconversation.com/our-third-covid-christmas-heres-how-things-might-play-out-195837?utm_medium=email&utm_campaign=Latest%20from%20The%20Conversation%20for%20December%2014%202022%20-%202490024956&utm_content=Latest%20from%20The%20Conversation%20for%20December%2014%202022%20-%202490024956+CID_e1e9e7957814f1bafc8ccb7d90098bfe&utm_source=campaign_monitor_uk&utm_term=our%20third%20COVID%20Christmas%20plays%20out