
Apparently we have a failure of security of supply of energy, caused indirectly by (i) UK storing very little gas any more (just-in-time is not security of supply), (ii) by China's increased demand, (iii) by Russia's deliberate under-supply policy, (iv) by being dependent on others (exactly what security of supply is not) and (v) by the failure of (one of several) cables from France to here.
Very good piece from the Guardian just today, [1], having meant to do this a day earlier. I've absorbed that, recommend it and then tried to look somewhat wider.
From the comments: The Private Eye reported a few years back that the UK had three natural gas storage facilities. Centrica warned that one was coming to the end of its working life and needed to be replaced. Centrica asked the government for a £30 million pound grant to help build a new facility. Chris Grayling the then energy secretary refused, despite being warned that a new facility would help secure the UK's energy security. The Eye said at the time "This short-sighted penny-pinching may come back to haunt us".
Gas
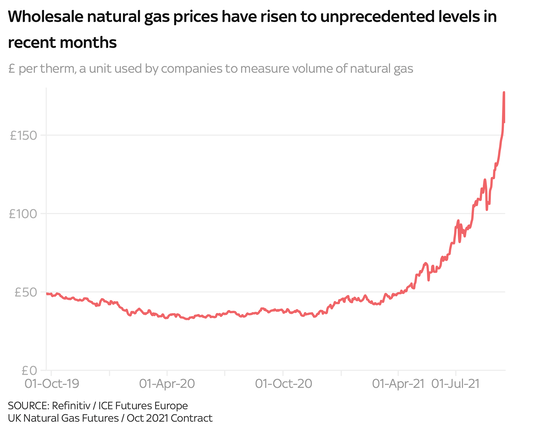
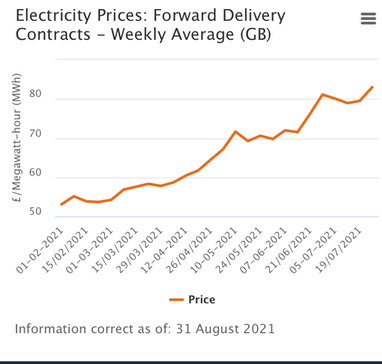
Gas prices in the UK have more than quadrupled over the last year to highs of 180 pence per therm, from around 40p/th this time last year. In the last month alone, prices have climbed by 70%. Rises are in the pipeline, ha.
The shift in wholesale prices of gas (top chart, from [5] hits a lot of the 70 energy suppliers (they are really traders, middlemen) whose business model relies upon guessing finely the margins between purchase early and sale later. The sudden shift breaks these models and so several have gone out of business almost overnight as what they pay today cannot be covered by the inelastic way they charge customers.
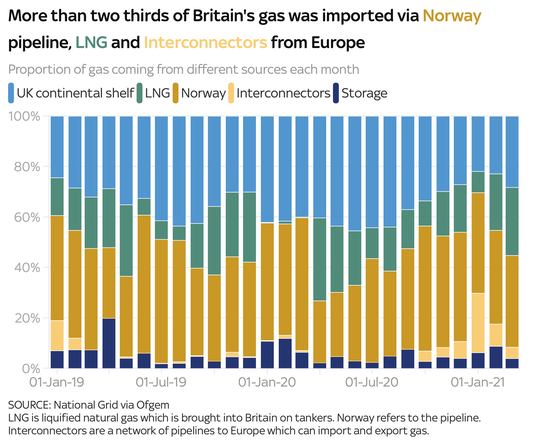
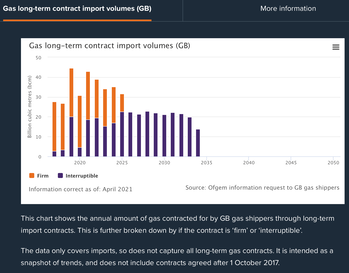
We use a lot of gas in the UK. For sources, look at the bar chart to the right; it comes from the North Sea (blue) or is piped from Norway (same sea, different ownership, dirty yellow). Some is tanked in, green, and a little is stored, dark blue.
I've added a chart (left) showing future gas imports. As the notes say, it only shows trends.
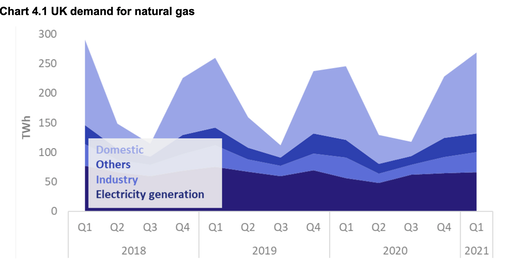
In 2020, 38% of the country's gas demand was used for domestic heating, 29% for electricity generation and 11% for industrial and commercial use. [5] More than 22 million households are connected to the gas grid, the UK government says. You see in the chart to the right that is a mix of blues that it is the domestic element that is the most cyclical and weather-dependent. [9]
Electricity
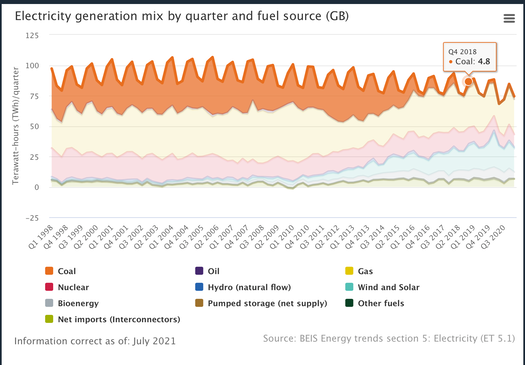
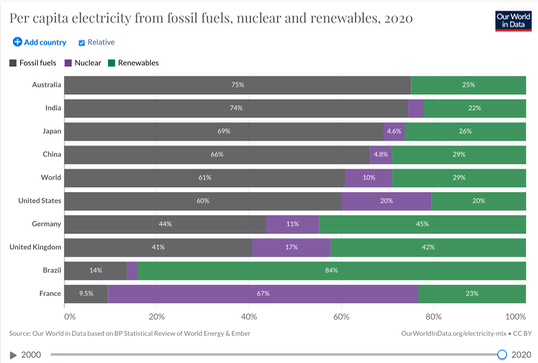
We use about a third of all our gas to generate about a third of our electricity. As the use of renewables has grown and become cheaper, so the use of coal has shrunk. The chart to the right shows the electricity generation mix. [4]. Across a year, say 2016, [8] the division was 42% gas, 25% renewables, 21% nuclear, 9% coal, 3% other. The expectation is that renewables will grow past 50%, that nuclear plants will be replaced, that coal will continue to shrink. Still in 2016 we imported 6% of our electricity. One can look up trends at gov.uk, BEIS, [9], which include oil, which mostly goes into transport, though we export a surprisingly large amount.
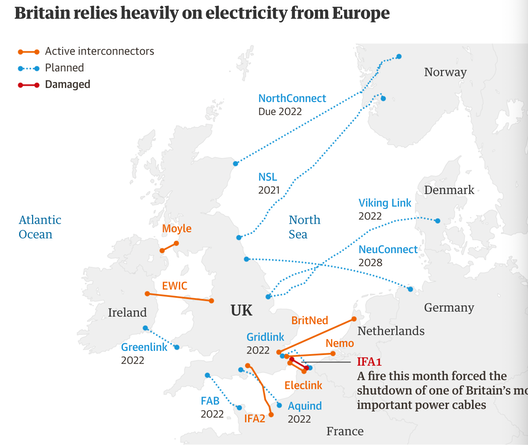
We send and receive electricity to our neighbours, as shown by this map, from [1] and [7]. Which is absolutely fine when we're selling it, of course, but not so good when one of the shorter French cables goes on fire on our side. A different class of failure—I cannot but help wonder if this is political arson. Yet we import 6% of our electricity, this is a net purchase and indeed the transfer out is very small. You can look it up, see the detail.
The renewable supply, [9] says, was down 16% from its 2020q1 peak. So 2021q1 produced some 20% less, though with capacity increasing by (only) 1.5% across that year. [9, p13]. Wrong sort of weather; how odd that we come to rely on British weather being itself. Wrong sort of snow on the line, etc.
Then there's our non-renewable electricity supply. We (our political experts) dithered over replacing nuclear power stations and there is delay and some confusion. See [10]. ¹ This demands (2021, now) clear decisions and firm action. The essential to grasp here is that nuclear provides energy security; it is always there and (almost) always ready. The more we shift to renewables the more we need to have stored energy and the capacity to provide supply on demand. We closed out coal-fired power stations but are having to fire them up (at huge cost) to fill in the gap – but that was why we kept them, to be available in crisis, so this is protection of supply, though very bad in terms of climate change. I have a bad feeling that decisions are being delayed until CoP26, Nov 2021 or shortly thereafter.
Some users are large scale and can be hit by price changes immediately, putting them in the same general position as the small energy supplier. These high-end users of large amounts of energy, such as steel mills and fertiliser production, are hit immediately, and so are likely to close. Thus we have steel mills not operating at peak energy price and at least two fertiliser factories (making ammonium nitrate, in Teesside and Cheshire ) have shut for the winter. A by-product of this is bottled CO₂, suddenly in very short supply, which we use for a range of things to do with food production (read [1]) and will have fairly immediate consequences for food supply; meat, fresh food including bread, drink — this will show quickly. Essay 368 explains.
Politically this is both bad and bad, with a faint promise of improvement. Nothing new there, then. Energy prices will jump with your (my, our, everyone's) next bill, perhaps by 25%. About 85% of domestic heating is from gas and as I've written many times, our housing stock is poor in that regard, needing a lot of heating. Current actions have repeatedly been prompted in the past and nothing done. Positive actions now obvious have been undone, so there's a lot of finger-pointing. I still say that while electricity is four times the price of gas there is no incentive to do very much but shoulder the increase; but then I recognised this years ago and planned accordingly. It still doesn't make a heat pump a sensible choice, not even if it were possible to use a heat pump as a sort of preheater to water then topped up by a gas boiler — chain them together. Gas has to double in price before the running costs equate, completely ignoring capital costs of installation, perhaps £15-20k.
Of course it is not unobserved that the people hit hardest and most significantly by any hike in energy costs are those same people that are already disadvantaged, looking at a reduction in universal credit (as the £20 pandemic jump is lost) and for whom life prospects just went from grim to grimmer still. These are largely the same people who live in lower quality housing, slipping from just-about managing to not really managing. Next we will have a cycle of 'flu and colds (my first for two years came home from school yesterday).
DJS 20210919
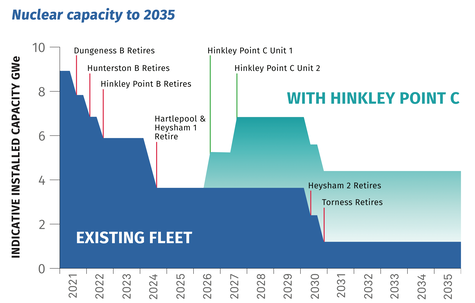
1 I do not see why this should be as confusing as it is. A lot of the capacity (nuclear plants generating electricity) is due to be retired, half of it by 2025. [10] doesn't help and I may yet delete its reference. [11] is better. I think Hinckley C is due on-stream in 2025, 4200MW.
“We are dealing with a legacy of under-investment and with Hinkley Point C planning to start generating in the mid-2020s, this is already changing. It is imperative we do not make the mistakes of the past and just build one nuclear power station. " This was reinforced in July 2017 with the National Grid’s update of Future Energy Scenarios. In the light of projected peak demand of 85 GWe by 2050, its main scenario called for 14.5 GWe of new nuclear plant online by 2035, and nuclear supplying 31% of demand in 2050. Different scenarios concerning electric vehicles increase peak demand by 6 GWe, 11 GWe or 18 GWe by 2050 depending on when the majority are charged, and assuming 7 kW charging (30 amps). The corresponding increases in annual demand range from 15 to 45 TWh.
In June 2021 the All-Party Parliamentary Group on Nuclear Energy called for urgent decisions to maintain at least 10 GWe of nuclear capacity. "The most critical step now is for government to begin legislating for a financing model for new nuclear in 2021.” It outlined a 10-point roadmap free of EU constraints.
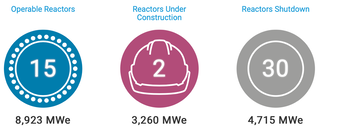
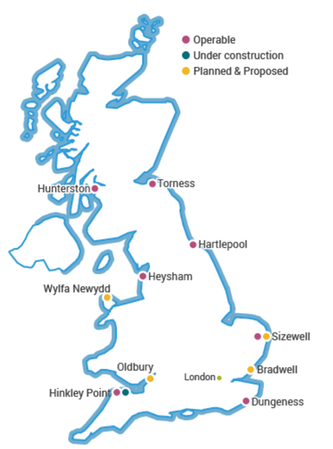
MWe is megawatts electric. We need around 10GWe of nuclear capacity, but possibly twice that if 2050 demand is 85GWe [11] and if we assume 20% nuclear source is an acceptable political target. I'd prefer 30% as potential capacity. What we don't have is clear decision from HMG. [11] lists the UK's nuclear power stations; the map here helps; the chart below shows the current shortfall.
[1] https://www.theguardian.com/business/2021/sep/21/what-caused-the-uks-energy-crisis and linked articles.
[2] https://www.theguardian.com/commentisfree/2021/sep/20/the-guardian-view-on-an-energy-price-shock-a-crisis-in-the-making
[3] UK Day ahead gas prices. https://www.catalyst-commercial.co.uk/wholesale-gas-prices/ Also look at [4]
[4] https://www.ofgem.gov.uk/energy-data-and-research/data-portal/wholesale-market-indicators. Note that the last few weeks are NOT included. I do not see why we cannot match the medical businesses for immediacy of data.
[6] https://en.wikipedia.org/wiki/Submarine_power_cable Lists cables laid. UK list next. https://en.wikipedia.org/wiki/List_of_high_voltage_underground_and_submarine_cables#UK_%E2%80%93_Europe
[7] open infrastructure map, from which I think the Guardian graphic came. https://openinframap.org/#4.93/51.93/-1.03
This also shows the cables from offshore wind generation. There is more detail available; https://openinframap.org/#6.3/53.828/-1.779
[8] https://www.energy-uk.org.uk/our-work/generation/electricity-generation.html
[10] https://www.openaccessgovernment.org/uk-nuclear-power/100749/ opinion source, not data. I am suspicious.
[11] https://world-nuclear.org/information-library/country-profiles/countries-t-z/united-kingdom.aspx Lengthy and detailed.
[12] https://www.politics.co.uk/reference/nuclear-power/ All-part parliamentary report linked next:- https://www.niauk.org/wp-content/uploads/2021/06/Net-Zero-Needs-Nuclear-–-A-Roadmap-to-2024.pdf
Installed solar power at 2019, table to right, confirms Germany and Italy ahead of UK. See wikipedia. On a W per head basis, Australia, Germany, Japan, Netherlands, Italy, UK...
Nuclear power capacity (wiki, 2020) puts France far ahead of the rest of Europe on 63GWe, the UK on 9, Germany on 8, Spain on 7. In terms of use, France 70% compares with say the US on 20%, the UK on 15% but several European nations belong in a ranking between France and the UK.
Installed wind power capacity (wiki), the UK is consistently 6th well behind large areas (China, the EU, the US, India) but also behind Germany and Spain and just ahead of France. UK capacity is 25GWe, Germany well ahead at 62GWe. On a per capita basis, the UK ranks 13th. The wikipedia lists are all sortable, so do visit there to play. To add to the confusion, one can also look at actual production, measured in TWh, which shows Spain and UK about matched at 50TWh in 2017, Germany on twice that, the US on five times and China at six (times as much as UK).
Installed hydroelectric capacity represents around a sixth of all generated and 70% of all renewables. In the UK this is small, at 2% of all and 4% of renewables. Compare this 2% of domestic generation figure with Norway at 95%, Brazil 65%, Canada 59%, China 17%, France 12%. Current (ha!) thinking in the UK is that hydro is a good way for us to store energy (basically, pumping it uphill with spare capacity as at Dinorwic), but does not compete well against offshore wind and photovoltaics. UK yield is around 5TWh per year, which you should compare with the 50TWh typical from wind. The potential for hydro-power generation is thought to be a further 3GW. There are incentives for small schemes to be built, but the last year with figures available we had only 15MW installed.
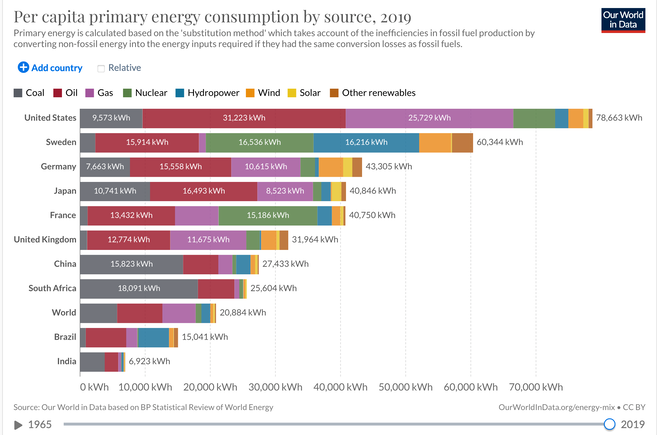
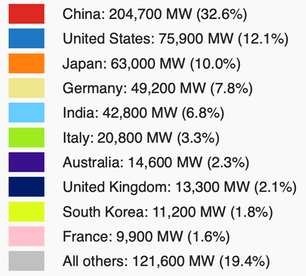
Looking for an alternative to wikipedia, I turn to OurWorldInData, which provides the panel to the right. The ways in which the data is handled then disagrees with other sources and therein lies a dispute one would like to listen to.
Stuff to check: Germany has, by far, the most installed solar power in Europe: 49MW, UK: 14MW. Check
France has, by far the most nuclear power in Europe and regularly supplies approximately 7% of the UK's total electrical power through a cross-channel interconnector. 97% of the energy transferred flows from France to UK. Mmm: I found 6% not 7% and 97% is from France to the UK. The significant link is the 1986 2000MW one, which is of course where the fire was. We should expect the exchange to shift towards balance in coming years.
Currently, household electricity in France is cheaper than the UK's. Not checked, but if the nuclear is subsidised........
UK is currently the largest producer of wind power in Europe, helped by being the windiest country in Europe. Not confirmed on Wikipedia at all. Germany well ahead by all the measures attempted.