
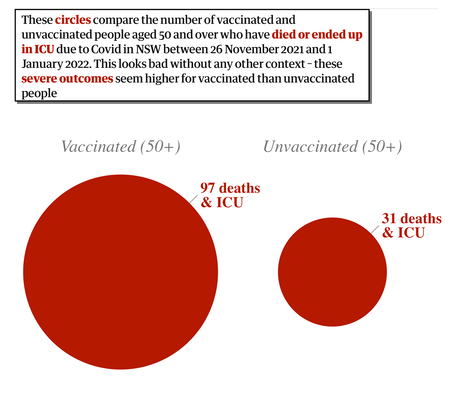
Source [3] §4&5, provide the detail used to create the red circles to the right.
From Table 6, between 26Nov and 08Jan and looking at covid cases with a severe outcome (which means ICU and/or death) there were 352 cases. Dividing the population between those with two effective vaccine doses and those with none (and calling them jabbed and unjabbed) we collect 272/267381 severe outcomes from the jabbed and 80/34219 from the unjabbed.
1. Produce a chart like the one to the right for this population.
2. Calculate the severe outcomes as a proportion of their populations, using the phut (per hundred thousand people)
The 'no effective doses' includes a lot of people who cannot be vaccinated. Subtracting the under 20s from all the figures the severe cases counts reduce to 268/234495 and 69/2552. That is right, some 31 thousand young people are excluded.
3. Repeat Q2 with these more relevant figures.
4. Draw a modified bar chart comparing these two groups of people. On the horizontal axis use a scale of 1mm per 5000 people, so the wide bar is about 5cm wide; on the vertical scale use 1mm for 50 phut so that the taller bar is about 5cm tall. The area of each bar is equivalent to the case count, so that the short fat one is 268 area units and the long thin one is 69 area units. Make your bar graph complete by showing a 10x10mm square marked with the representative total case count.
It makes a lot of sense to concentrate on the over-50 population since they are by far the most at risk. For New South Wales [NSW] this changes the figures above to 220/57717 and 53/651 so the relative difference in cases per hundred thousand hardly changes, remaining above 20 times bigger for the completely unvaccinated.
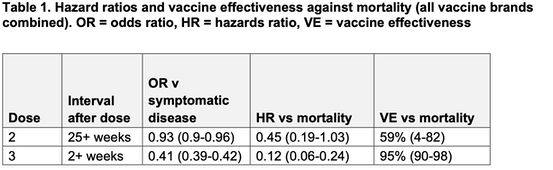
The equivalent figures are not made available in Britain, but the problem is adressed and is expressed quite differently. The most relevant table (Table 1, [4], shown) I found estimates vaccine effectiveness for those aged 50 years and older by combining the risk of becoming a symptomatic case with the risk of death among symptomatic cases in vaccinated (all vaccines combined) compared to unvaccinated individuals (Table 1). At 25+ weeks following the second dose, vaccine effectiveness was around 60% while at 2 or more weeks following a booster vaccine effectiveness was 95% against mortality.
I read this as saying that the risk of dying (bottom right figure) if unvaccinated is between 10 and 50 times higher than if vaccinated. That doesn't tell us about going into ICU and surviving, which requires one to explore the hospitalisation figures and distinguish the severe cases.
[5], from the British Medical Journal, reported up to the end of 2021 that the 61% of those going into critical care in hospital were unvaccinated. In these figures unvaccinated includes those who had a jab within 14 days of a positive covid test (so the jab would have had no beneficial effect) and thus, in comparison to the NSW figures, includes the population with incomplete vaccination. For the last week of 2021 a total of 815 people with confirmed omicron infection were admitted from an emergency department to hospitals in England. Of these, 74% had not had three doses of vaccine—including 25% (206) who were unvaccinated, 6% (49) who had received one dose, and 43% (352) who had received two doses. Twenty three percent (189) had received a booster dose, and the remainder were unknown or had had their first dose less than three weeks ago. [5,6]. If you read source [6] then the wealth of detail tends to overpower the simple message that vaccination dramatically reduces the likelihood that catching covid will put you in hospital. The size of the difference depends on the variant you catch, which vaccines you had and how long ago. But, whatever your personal position (age, co-morbidities, general health) the risk of being badly ill or worse is hugely reduced.
DJS 20220128
[5] https://www.bmj.com/content/376/bmj.o5
A1. Circle of area 272 units vs circle of area 80. If the smaller diameter is one, the larger is √(272/80)=1.84
A2. 272/2.67381 = 102 phut; 80/0.34219 = 234 phut (to 3s.f. or the nearest integer)
A3. 268/2.34495 = 114 phut and 69/0.02552 = 2704 phut (to the nearest integer)
A4. 2.35 wide, 114 high =>268 cases; 0.025 wide by 2704 high =>69 cases. So the bars are (in x,y terms) 47x 2.3mm and 0.5x 54mm, so that has been probably drawn with no visible space between the sides. The centimetre unit square represents 100 cases.