
The onset of an event of the scale of covid-19 gives reason and opportunity to rethink our institutions. Being the current disaster that we are, I suspect that our government wants to return to their comfortable space; to not take many of the obvious opportunities to make the country a markedly better place.
However, let's look first at the relatively simple task of managing to return to school in September. Or August, if you're in Scotland. On this occasion, it is England that is the problem; England is the majority population by far, the land is far more densely populated, the prevalence and incidence of covid-19 are significantly higher. One can understand why Scots, Welsh and Irish might well wish to close —or at least have restriction upon—their borders with England.
Here's a helpful chart [1] that replaces some more wordy stuff that I've written in emails to long-suffering friends.
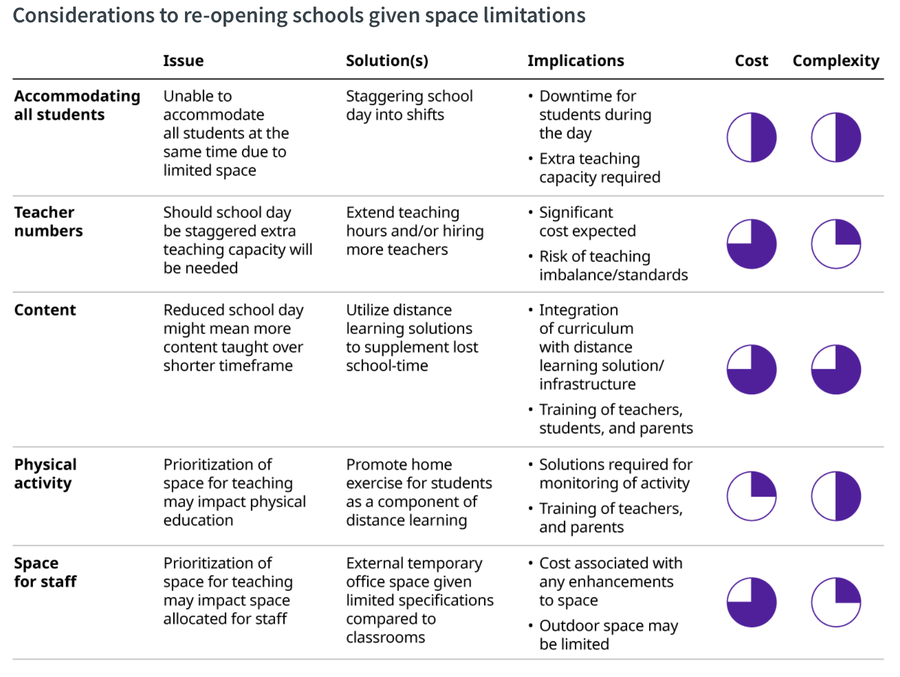
To this I would add an offer to all parents for online content in lieu of a physical presence at school—not a requirement, an offer. That way, the parents can make an informed choice to return their kids to school and on what basis they do that; the parents who cannot do wfh¹ are treated by school as more important, and those who can do wfh are then encouraged to recognise what aspects of school are useful, in the sense of adding to the education of their child. Of course, there are massive obstacles in discovering who has done what while school has been 'off', in keeping a class together in any academic sense and I'd suggest that the age of assumed competence could be lowered, so as to make it the child's problem to have 'done' topics sufficiently well. that might change one of the shifts implied above to a very much more flexible, directed teaching, as some of those many online courses have become.
We have an education system that works very well for the smart end of the spectrum, but essay 292 demonstrates that we have dramatic failure: "in 2012 we had 49% of the adult population, some 17 million people, with no better than the numeracy expected of an 11-year old." That says to me that there is a least one STEM subject that is in a state of abject failure. Or it says that we really don't care about the bottom half of the distribution. Bearing in mind that the bottom half for clarity or competence in English (whatever home language applies) has a scary overlap with those bad at numeracy (it's not maths, that's harder still), we have something like 40% of our population for whom education is already some sort of failure.Â
We could and should do a lot better than this.
I wrote about numeracy in #292, but the bigger question raised there is to ask what we really want from education. I suggest, still, that there is a minimum level of language (English) and numeracy, that we could describe as adequate for functionality, which some would reach by the age of eleven (KeyStage 2) and many would have reached by KeyStage 3 (year 9, 14-ish) — but not all. This rather implies a return to the 11-plus test as a separator into academically inclined and not-so-much. But the two non-grammar solutions did not produce enough people with their curiosity intact, nor enough with skills that would serve them well. Though the idea of the Technical College was good, it seems to me that it didn't succeed as it should have. I wonder what was wrong with the model that caused these results. I am quite clear that we do not specifically need the return of the grammar school, but I'm moving to thinking that a return of the technical college might well apposite.
Apparently, [2] tells me, there were some issues; technical schools are expensive to create and maintain; sexism was much worse than now; there was this contrary push for comprehensive education; technical colleges ended up delivering a more ordinary academic curriculum. Technical colleges were supposed to be selective, but the built-in academic bias (a bias towards academia) guaranteed that the high-fliers went nowhere near any technical work unless they were lucky enough to have such facilities within their 'grammar school'. We could do this again and very much better, but we need to be clear, I repeat, about what the minimum common credentials are— what (very nearly) everyone can be expected to be able to do.
Education is separated into levels as defined by the Regulated Qualifications Frameworks (RQF), nine levels from 0-8, where 8 is doctorate level and the bottom, entry level, is subdivided into three. These bottom levels are, I think, similar to the levels generally achieved at KeyStages 1 to 3. To compare with European qualification (EQF) levels, 1-8, RQF 4&5 equate to EQF 5 and RQF 0-3 equate to EQF 1-4. This makes a lot of sense; RQF3=EQF4=A-levels and AS levels and their equivalents, while RQF6=EQF6 = Bachelor's degree. See [4] for detail.
During WWII, which some think was a similar level of disruption to that of the pandemic, the Norwood report took a long hard look at what we wanted and were producing from education. Many of its recommendations were adopted in the period immediately after the war. We need a new Norwood report [2]. We need that thinking in hand already and the content under consultation. We also need for education to be taken away from politicians, but I have been saying that for a very long time.
I looked up attainment for England, since it is 86% of the nation: see [3] and wikipedia. I spent quite a lot of effort trying to substantiate the numbers here, in the sense of seeking an original source. I am unsure that I succeeded.
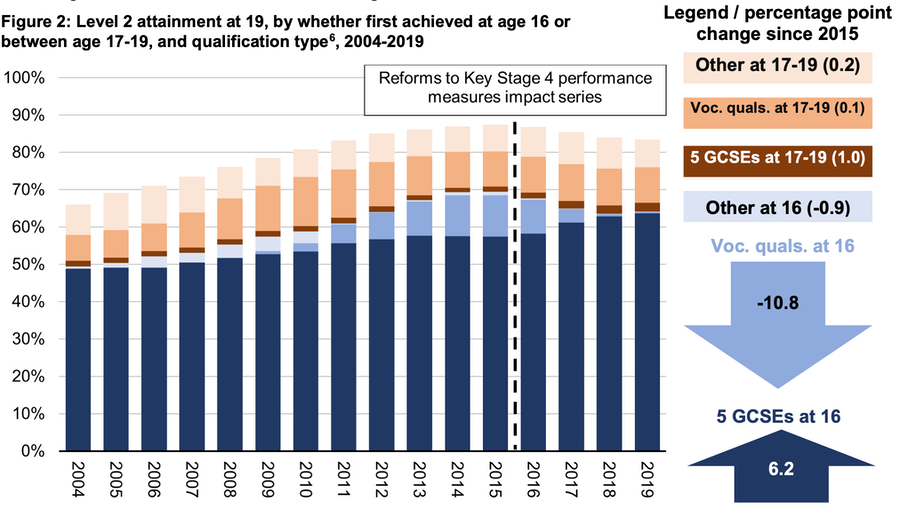
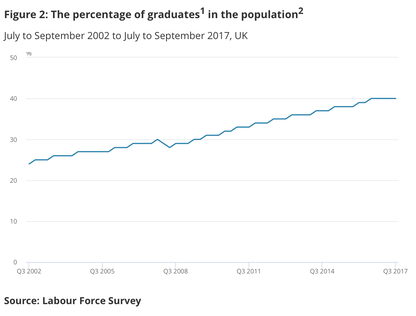
At age 25, 90% or so of the population has reached level 2 standard; it is immigration (more than education change, say I) that brings the whole population down to the 83% figure in the table. I wonder if that is as good as we can do, even after we've justifiably stretched what we mean by any levelling measures taken to include a wide range of non-academic qualifications. The take-up of these is, by my lights, poor. I copy Figure 2 from source [3] to show this.  The 5GCSE qualification, at around two-thirds of the population, is similar to the proportion with level 3 at age 25, suggesting that eventually many of those same people go up a level. I have no objection to this, but I think the 'other' and 'vocational' ought to take us very much nearer 100% of the population. ²
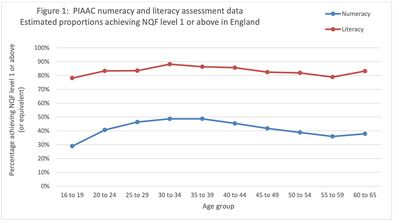
Numeracy / literacy from [5];  NQF level 1 is equivalent to OECD level 3 as used above. That is confusing: NQF lasted until 2008, replaced by QCF and then RQF in 2015. OECD level 3 should be the same as EQF 3, but proving that is difficult. ³Â
Over the period 2003-2013, the UK has seen a marked shift towards attainment at the highest qualification levels5 (Level 4 and above) and away from those without formal qualifications or qualifications at the lowest levels (less than Level 2). The proportion of the adult population6 qualified at a high level increased from 26.8 per cent to 37.5 per cent, whilst the proportion with no qualifications or low level qualifications as their highest qualification fell from more than one third (34.1 per cent) to less than a quarter (23.4 per cent). [6] This sounds like a significant improvement.
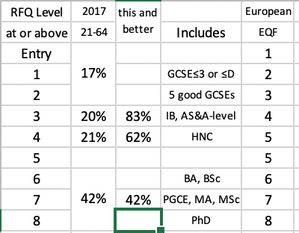
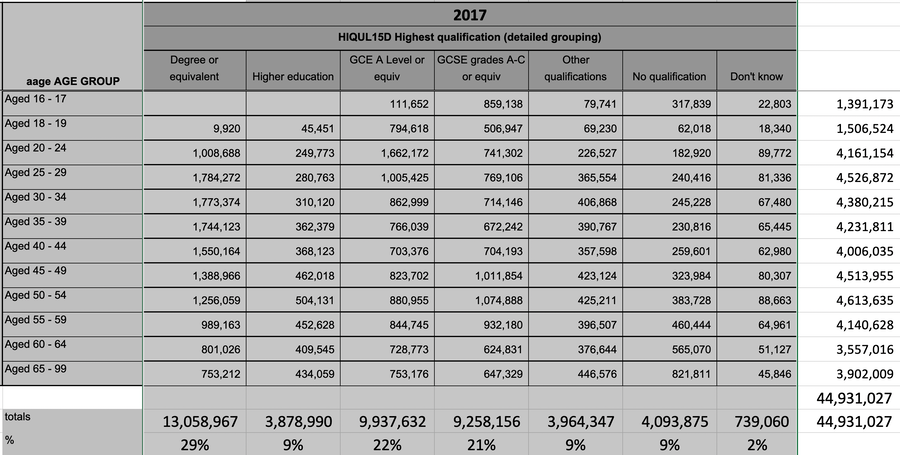
At level 6 in the UK we have a steady increase in the number of people with degrees. Source [8], which covers autumn 2017, says there were 14 million graduates: it says that graduates are far more likely (than non-graduates) to have a job, to find a job, to rate as skilled, to earn more and for those earnings to peak later (which is a good thing, once you think about it). Best subjects in terms of pay are medicine and engineering. For population figure purposes, the people included are adult working age 21-64 and not in education; this was 34 million people in 2017. So, as shown in my spreadsheet excerpt earlier :-
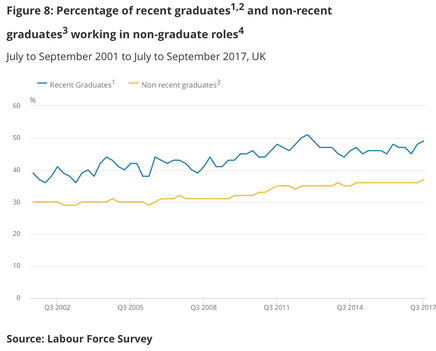
•  level 6     42% of the working age population are graduates or equivalent, but that does not mean they work at that presumed skill level. Figure 8 applies. A 'recent graduate' joined the labour force within the last five years.
•  level 4     21% have A-level equivalents but no more
•  level 3     20% have (5?) good GCSEs but no more
•  levels 0-2  17% have no qualifications or qualifications not recognised in the UK, split evenly between these categories.  This is the group I think needs greatest attention, even if the result is to create recognition of the skills they do have. Skill levels are defined according to the Standard Occupation Classification (SOC) 2010 lower level groups. â´Â
Figure 12c of [8, not worth copying] shows median pay per hour at roughly £17.50 if you went to a Russell Group university, and £15.75 if you went elsewhere. âµÂ Read [8] yourself. About 2% males and 11% of females are typically out of work ("inactive") because they are looking after family (kids or parents). Males still earn 3% more than females (and that should be carefully justified wherever it occurs). Graduates move towards the money, such that half of Londoners are graduates, whereas all of the North and Midlands has less than 35% (see Fig 16a).
So what do we need from education? What is it not providing? What do we think education is doing well? What could we do (dramatically) better?Â
Suppose level 3 is the acceptable minimum. Suppose further that when we add young immigrants to our school system they succeed well enough. Then that suggests that the bulk of the 17% not reaching level 3 is adult, including adult immigrant. In which case we need to provide attractive incentives to move those people into education. Our first target here is dramatically better English, but that is only a constituent part of achieving level 3. We must, I think, pay for this resource, but equally we need to demand that more of the population achieve that standard. So I'm thinking this should be free to learn but seen as valuable; not judged worthless just because it is cost-less. Exploration of equivalents is needed, too, along with some much better and well explained measures of what sorts of education succeed. I don't mean teaching to the test, I mean teaching in ways that work for the targeted audience. I wonder if we care very much what the other four GCSEs are for level 3 and what the acceptable substitutes might be. I make an oft repeated call for proven competence in numeracy, not mathematics (statistics not trigonometry, and so on; practical, usable content).
As for level 4, A-level and its equivalents, I do not think it acceptable that we lose a further 20% of the population in that gap, such that more than a third of the population has less proven education than whatever is equivalent to A-level, AS-level and the International Baccalaureate. When we demand that people stay in education to 18, we really should be producing more in terms of result.  â¶Â
Further hunting for content produced very little but frustration. I should be able to think up some dramatic improvements, just as I should be able to find damn good suggestions elsewhere.
I suggested on one of the pages discussing the future of maths that I'd like to see compulsory education become a lot more flexible. I still think we can justify free continuous education to an age like 18, but I think we ought to have further education for another five years, that can be picked up at any time later (including as a pensioner). Further still, that this be given a value such as median wage (something measurably better than the minimum living wage) so as to encourage people to do this. I would like to see apprenticeship awarded and rewarded in a similar way for pre-18s, so that people who find academia hopeless can easily move to a different form of education with proven results equivalent to the alternatives. That is, that there be viable, comparable alternatives to what we currently think of as 'school'. I would be entirely comfortable with an insistence that 'school' continue to a specified age like 16, but that we returned to offering selective technical schooling 11-16, with apprenticeships an attractive alternative 16-19 or 16-21.Â
But I would prefer that state-supported education (of long-standing natives) did not stop at 18 or 19. I think we could justify offering education for three, five or even seven further years under some sort of equivalent value scheme. So that those who stay in education to 21 have maybe two or four years remaining to use later in life (think Master's, MBA or even both), but perhaps not enough to finance a doctorate without some paid element, much as we do already. If the additional years I suggest were seven, then 'free' education could include medics, architects, engineers and doctorates. For those for whom academia is something to escape as soon as possible, compulsory education would reach to 16, a chosen path to 19 and then there would be a number of years of 'free' education to claim later in life. This would allow people to change their minds, to choose to have a year or years 'out' of education, to earn and learn from experience — and to choose in a positive way to return to academia for later education, such as is now done through foundation degrees leading to graduate degrees and their equivalents.
There are many possibilities here to provide stimulus: education post-16 or post-19 could be subsidised. In effect , you could be paid to do study, so as to add to the attraction of further study and qualifications. This could be pitched so that the value paid was scaled to match inflation. E.g., the value at age 18 in 2028 is scaled as if invested at a shade better than inflation, such that at age 35 in 2045 it is an equivalent sum, not the same as would be offered to an 18-year-old in 2045. This could be described as a voucher scheme, in that you have a number of years of education on offer, specific to you as an individual and not at all transferrable. When your allowance is used up, fees apply; if you don't use your allowance there is no benefit; there has to be very wide choice to make this attractive; the individual is free to 'waste' their allowance, or to save it for later and when they are ready, or to use it immediately in serving some obvious objective.
Is this a serious cost to the nation? I wonder; the return on student loans is sufficiently low that in effect we are subsidising a prodigious number of people to the age of 21 and beyond already. This is unfair on those for whom the academic route and routine is unhelpful and unattractive, in that they are in effect being denied access to these benefits. if the underlying issue is that we need for more nearly 100% of our population to be educated to whatever we declare to be the minimum desirable level—and 'more than we have' is a must, I think—then this does not add enormously to the current cost, while very obviously giving direct assistance to those for whom education has ostensibly failed. Visible levelling up, indeed.
The one remaining issue to consider is what we do about those who migrate, both in and out. Just how many (few) years does one need to be paying tax before this scheme kicks in for adult migrants? We might argue that RQF level 2-4 is on offer immediately to any age of immigrant; we might argue that someone who chooses to live overseas, or to hang onto dual nationality, is denied (further) access to the scheme; we might argue that time in education elsewhere equates to use of the scheme (even if it clearly does not).
What is important here is the 'levelling up' element. The loud and pushy middle classes that already have good education are not at issue here; they can choose to have private education to 18 if they wish and they will, no doubt, continue to have advantages. That is not what is relevant;  it is those that the current system rejects that are the issue. These are the people who don't achieve the RQF lower levels; these are the people where it is in the national interest to raise that level. What is less clear is quite what we demand from the framework, what it is that we will accept as equivalence. I think we need clarity, I think we need to accelerate when this occurs, especially to people we accept as additions to the nation, and I think we need to have the vast majority of the population supporting the concept and appreciating the benefits, including the indirect ones.Â
I admit that there is a space in which we might decide who is included and excluded, though I am not readily prepared to accept exclusion at the disadvantaged end of the spectrum.
Inclusion, not exclusion.
DJS 20200806
top pic from the SundayTimes 31May2020
edits and extension 20200810-16
Guardian piece, 12Aug20,Â
Much of my current confusion comes form this piece,  which includes these snippets: ...Scottish Highers, which in 124,000 cases had marked down the grades assessed by teachers.   Around 300,000 Scottish pupils take Highers each year, while only 250,000 sixth formers in England take A-levels despite its larger population – meaning A-levels are taken by a narrower and more advantaged band of the population. (Some Scottish independent schools also do A-levels rather than Highers.)   [In England]... in around 100,000 cases, pupils take level three Btecs, which are modular, more vocational courses equivalent to A-levels. Based on Ofqual’s statements, as many as 100,000 entries by candidates may have been assessed as deserving A*s in courses by their teachers. But last year fewer than 60,000 A* grades were gained in exams – suggesting that Ofqual will downgrade the remainder.
from a different piece, the day before: John Swinney made an emergency statement at Holyrood on Tuesday afternoon after a furious row last week when the Scottish Qualifications Authority (SQA) announced it had downgraded 124,000 exam results, moderating the recommendations of school teachers in nearly a quarter of all awards.
Swinney told the Scottish parliament he was directing the SQA to reinstate all the downgraded resultsto those originally recommended by their teachers, and apologised to all those affected, including 76,000 pupils.
Is there a way of offering additional education (in any form) to those left unemployed for sufficient period? How is that done already? I have no idea.
20200812 edit:
The fuss about Scottish Higher results and A-level results produces the information that there are 300,000 students receiving grades in Scotland, but only 250,000 for A-levels plus 100,000 on BTec courses. See the adjacent text box. This is a confusion: the large number in Scotland is the equivalent of AS results (exams at age 17) in the rest of the UK and should not be compared with A-levels, though they are sat at the end of school.  See.  It would be far better to compare A-levels with Scottish Advanced Higher, a number more like 20,000 candidates, which collect the same number of UCAS points as A-level. The idiot numbers confuse subjects with candidates; indeed it is quite hard to be in any way certain what any number refers to. The confusion is perpetrated further since most degree courses are 4 years in Scotland; I've always thought the 1st year equivalent to a foundation course in England. Not better or worse, merely different; better for some people, inevitably.
The SQA published this, which indicates 146,643 pupils achieved SCQF6 (Scottish Higher) out of 185,844 entries, up about 5% on last year, 2019. Advanced Higher was 85%, or 20,010 successes, up 5% on last year. So the 300,000 figure is not understood, but might be subject results not students. The Scottish grades  rank Higher as RQF3 and Advanced Higher as RQF4 and EQF5, so the A-level equivalent is the 20,000 figure, with whatever rates as BTec equivalent (probably called BTec level 4) yet to be discovered by me.
The remainder of Britain is expecting 730,000 results (that's not examinees) on Thursday 13th. Scotland is 8% of the whole, so proportionately we would expect there to be a number like 230,000 candidates for these 730,000 results. There are around 800,000 18-year-olds in the UK, probably a bit less (fewer; 766k in 2017 with an expected decline). So I would expect there to be 55- 60,000 school leavers in Scotland at 8% of the UK. That number neither fits with the 76,000 at the end of the text box, not the 147,000 who apparently sat exams, unless there is a common practice of sitting exams twice in adjacent years.
An OECD report from 2007Â says the absolute total of school age children (from Table 6) was 703,869 and those in the system then who'd be leavers in 2017 ought to be about 54,000. However, there was a significant drop then post-16, which was permitted then. I need something more recent.
From here, I have this, which suggests 776,456 A-level entries in 2019
Table 9 from the same source suggests that the total number of students attempting Level3 (A-level and equivalent) in2019 was  335,134 in England, where this means at least equivalent to 2 A-levels and not previously included in results.
What ought to be telling me what I want to know should be here, Statistics: 16 to 19 attainment 2018/9. I'm not impressed that the 2018/9 report was not published until Jan 2020. Does it really take that long for the numbers to stop being adjusted? Worse, this is only England. One begins to wonder if the nation is already divided — that one simply has failed to notice that this is the DisUnited Kingdom.
I will sort this out eventually. Though I may have to give it up as a hopeless case.
Edit 20200814:  of 730,000 results, 280,000 were downgraded (Guardian), More than a third of results in England (35.6%) were downgraded by one grade from the mark issued by teachers. A further 3.3% dropped by two grades and 0.2% were downgraded by three grades. [....] More students have been accepted on to UK degree courses this year, Ucas figures show. A total of 415,600 people, from the UK and overseas, have had places confirmed, up 1.6% on the same point last year, according to data published by the university admissions service.
The OfQual summary offers these points: Â
*  Overall A level results in England are higher at grade A and above compared to 2019 (27.6% in 2020 compared with 25.2% in 2019). This reflects the approach to awarding grades this summer and the decisions that, where possible, have been taken in students’ favour, as part of the standardisation process.
*  The majority of grades awarded to students are the same or within one grade of the centre assessment grades (CAGs) – 96.4% at A level and 91.5% at AS.
* Â Entries for reformed AS qualifications in England have dropped by over 26% compared to last summer. This makes it much more difficult to interpret any changes in year-on-year results.
Here's a link to the OfQual infographic. It seems to me that a lot of the complaint is misdirected; the number of top grades has risen on 2019 by 2% or so, which is quite enough grade inflation. My first reaction to the upper grade numbers was "That's far too many", but the centre-assessed grades would have given a 10% jump. [Up 12.5% just for grade A, says OfQual]  I'm therefore pretty sure that most single grade changes will be refuted and the worthwhile challenges are for changes downwards of two (or more) grades. Of course, the climate at any and every school is that all changes to what the teacher said will be challenged; I wonder how many shared their prediction with their pupils, building an assumption of consequence.
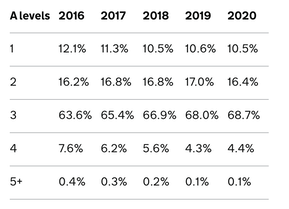
This little table shows the percentage of students by the number of A levels taken per student (18-year-olds in England). the average number of A-levels per student is consistently close to 8/3.
Of Qual looked at a potential relationship between advantage and results; Report here. What OfQual has clearly not done is test its awards of grades for unfairness at an individual level, or even a school level. Yes, at a regional level and upwards the results look fine, but it is soon clear that the algorithm used is far too simplistic and ruthless—and therefore quite insufficient to the task.
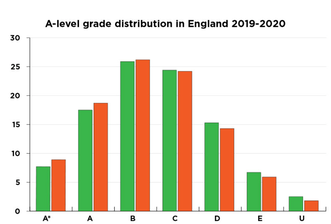
I found elsewhere the distribution of grades compared by year, found here, though I'd have liked 5 years' worth. Maybe it will appear in time. I think OfQual have done well to offer so much so immediately.       Â
Considering how very long the exam boards had to play around with grades the results promulgated are very nearly useless. Having handed them out it is probably impossible to reduce any award. Therefore all the resulting corrections will be upwards and bang goes the political target of no appreciable grade inflation. The typical 21st-century righteous rage will demand that everyone's little darling be given the best possible grade for (too  often) having someone with a big voice and presence in their corner for them. Meanwhile, then, the disadvantaged will be more so, at a time when what we need is very visible fairness. The number of cases of a centre-assessed grade going down two or more (B-D or far worse C-U) means that some 3.5% of all those grades (which is the count of those moving that much) are going to change. that's before we have the shouting and screaming that results in most of the one-grade shifts being restored. This could have been avoided by demanding that the centres justify whatever significant differences there were over previous years, by requiring evidence to support these outliers (except that is not what they are except in the very local classroom sense; there are simply too many). And, I suggest, making sure that people at each Centre recognise that they are the ones who will be held to account where the school produces a significant overall change in its distribution of awards. Not difficult, but not done. So where was the incompetence? Will we learn from this? I say we will not learn from this because our education system does not do that and has had no opportunity to do so since politicians took a hand. we are hoist by our own individual experiences, where one data point (what happened to 'me' at 'my' school, is held to be not just typical but representative of everyone else. That is plainly a recipe for disaster as it means the privileged only ensure that the privilege continues. At no time do I argue for the cessation of non-state education – it clearly works, it clearly succeeds and it id also clearly mostly money well spent. I do, however, think that it also sets up a comparison that shows that the state system could do better than it does. I do not say that it should copy the non-state (independent) sector but that it must decide what it is that it is truly there to provide – and to work towards delivering that which it is so clearly failing to do at the moment.
  DJS 20200814&6Â
1 wfh = working from home. I continue to want to type wtf and wth. I disagree with the upper case shortforms, (WFH,WTF, WTH) because they are not Proper Names  (DoE, DHSS, DWP, HMRC; NQF, EQF. RQF etc.)
2  Level 2 in English & Maths has settled at around 71% for the period 2015-19 for those aged 19 in 2019. In 2019 those aged 25 (who were 19 in 2013) had done a little better at 19, but 90% had reached level 2 by the time they were 25 and around 66% had reached level 3. The figures show what might well be grade inflation followed by a drop when we switched from letters ascending (A* to G) to numbers descending (9-1). It would be relevant to ask what happened to the vocational qualifications since 2016. It seems to me that they should not have shrunk in volume.
3  OECD level 3 explained where? Equivalence to UK qualification under RQF explained where? Source [11, 2019] simply adds to the confusion, I quote from page 1 87% of 16 to 64 year olds with a level 4 qualification (equivalent to degree level) or above were in employment in 2018; this dropped to 82% for those with 2 or more A levels (or another level 3 qualification), and 75% for those with 5 or more GCSE passes (or another level 2 qualification). That's not level 4, it is Level 6 equivalent to a degree; or else this is a different reference framework.
4Â Â High, in this case, means the skill was acquired by degree or its equivalent, generally described as professional or managerial; level 6 plus. Upper middle is below level 6 but more than level 4, includes technical and trades occupations and people that run small businesses. Lower middle is level 3 and 4, requiring no more than is achieved in compulsory education but with a lengthy period of training and experience, so this includes driving, caring, retailing, clerical and secretarial. Low skill level has short training, so includes postal workers, hotel porters, cleaners and catering assistants.
5  Suggestion for an assembly: So on 2000 hours a year this represents around £3500 per year, £140k total across 40 years. Of course these are very average figures, but they might serve to argue with Y12 and Y13 that this justifies extra effort. Assembly suggestions: show the added pay for a good university as leverage to work a lot harder at school. Show the increase in pay for a 'good' degree (if you can find that) to argue for working at university (or not). I'd want to show which degrees are more likely to produce money. I'd also qualify all of this content by looking at other skills and some trades. Of course, what you really want to know at Y12/13 is the range of income and how that relates to work now, on the implication that your objectives are things like less work later or more pay sooner — or objectives that have little to do with pay once it has passed 'enough'. Sticking to just one point makes for a powerful message, so you might want to do a series, each with a pointed message. For example, lots of graduates go into teaching — why would you do that, when it do clearly conflicts with the loadsamoney attitude?
Source [9] provides some counter-information: sales, HR, retail & wholesale management may  rate as a graduate job, bit these roles are successfully filled by non-graduates. 58% of graduates work in either 'professional' (teacher, doctor, lawyer) or 'associate professional' (sales, marketing, IT)
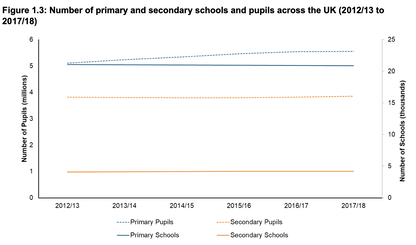
6  Source [12] We have 10.3 million pupils in the UK, 3.9 million of which are at secondary school, around 17,000 of whom are in referral units. so we have between 500 and 600 thousand pupils in any year group at secondary school. We have about 2 million undergraduate students full- or part-time (but I don't know how many are non-native). 2013-7 we had a little under 5% of those aged 16/17 not in education, employment or training (called NEET, as in 'neet there').
in 2017 the average Attainment 8 score at GCSE was 44.6 (girls 47.6, boys 41.8). At A-level 56.9% of the population aged 17 in England achieved at least two substantial level 3 passes. I am still not clear if that really means A-level, which is level 4. Tables 3.3, page 16 and fig 3.4 repeat what I'd already discovered about the working age population.
Â
 'Attainment 8' and 'Progress 8' need to be understood.  Attainment 8 measures the achievement of a pupil across 8 qualifications including mathematics (double weighted) and English (double weighted), 3 further qualifications that count in the English Baccalaureate (EBacc) measure and 3 further qualifications that can be GCSE qualifications (including EBacc subjects) or any other non-GCSE qualifications on the DfE approved list. Each individual grade a pupil achieves is assigned a point score, which is then used to calculate a pupil’s Attainment 8 score (see second step below). source. Go to page 3 if you want the Attainment bit, but that is so as to compare different year-groups and hence some measure of progress by a school. Attainment (Y11 total score divided by school roll) will lie between plus and minus one, representing a grade plus or minus on previous years and with a 95% confidence interval. Schools want their intake to have poor (non-representative) KS2 results so as to magnify their added value effect. Conversely, some of us already know that if you test English and Maths at the start of a key-stage you have a good idea where kids will end up; this uses that idea to measure the effect of teaching.
Â
ⷠ⸠⹠ spare footnote numbers  6 7 8
Edit 20200929  Late yesterday, an academic year too late to be of use, the government makes an announcement to the effect that it will fund people to reach A-level equivalent. [14].  At present, the government pays for a first A-level equivalent qualification up to the age of 23, but this is being extended to all ages for courses deemed to be valued by employers with further details of those available due to be set out next month. Actually, the current mess we have with pre-announcements means that this will be announced today. The buzz phrase is lifetime skills guarantee. Lots of shouting at money being thrown at the problem but, as so often happens, it will be a very long time before anyone is able to tell if the money is being spent, and whether any spending is as intended. Given the mass move to online teaching, I was confused by Reforms will be backed by investment in college buildings, including more than £1.5bn in capital funding, the government added. The vehicle for this is the National Skills Fund and follows a suggestion from the Labour front bench to that effect. Unfortunately the people currently without work and recognising that they need to change —to re-skill, in gov-speak—will have acted already. Leaving what support there is to next academic year places, to my mind, more obstacles in the way. it remains unclear how anyone finds the time for any course and, in consequence, finds the money to fund themselves not-earning while taking the course. I think the smartest people will have already signed up for university courses (yes, that's another level up, but a foundation degree would have been available, given the reported drop in uptake (81k to 30k since 2000, says [14]).Â
[1]Â https://www.oliverwyman.com/our-expertise/insights/2020/jun/re-opening-of-schools-post-covid-19.html
[2]Â https://schoolsweek.co.uk/what-happened-to-the-old-technical-schools/
[4] Â https://en.wikipedia.org/wiki/National_qualifications_frameworks_in_the_United_Kingdom
[6] https://assets.publishing.service.gov.uk/government/uploads/system/uploads/attachment_data/file/470017/skill_levels_2014.pdf Is this really the most up to date publication on the subject? That doesn't seem good enough. UKCES Report 61 (Bosworth) is dated Nov 2012.
[7] https://assets.publishing.service.gov.uk/government/uploads/system/uploads/attachment_data/file/900328/FE_and_Skills_commentary_July_20.pdf goes some small way toward the update on [6]. over 250,000 adults (over 19) are doing English and Maths (¼ M on each of these)
[8] https://www.ons.gov.uk/employmentandlabourmarket/peopleinwork/employmentandemployeetypes/articles/graduatesintheuklabourmarket/2017#steady-increase-in-the-number-of-graduates-in-the-uk-over-the-past-decade which is the latest release at Aug 2020; next of these is expected Nov 2021.
[9]Â https://www.ons.gov.uk/employmentandlabourmarket/peopleinwork/employmentandemployeetypes/articles/oneineightyoungpeoplewithoutdegreesworkingraduatejobs/2018-09-18Â Headline: Â One in eight young people without degrees work in graduate jobs
[10] Â https://foresightprojects.blog.gov.uk/Â Â Â a site to watch.
This spreadsheet data originally from the ONS [13]. It agrees with most —but not all—of the 2017 data already found.
Related pages:
312 - School post lock-down this very page
249 - British Social Attitudes