Following COP26 in Glasgow I thought there ought to be a collection of worksheets using climate change as a base idea. I have tried to write problems that collect under a topic heading, while exploring the general issue of reading and understanding. So, for example, the page on trees provides some information and then asks questions that, hopefully, serve to extend the understanding of what 'more trees' begins to mean, not least that the implication of matching Europe's level of woodland in England, moving from 10% to 40%, is more than the space we are likely to make available. Bit me writing that and you understanding it because you've moved the numbers around for yourself are two quite different levels of understanding.
I've generally tried to keep each of these to 10 questions, where generally there is some grading from easy to hard and where the last question is more of a comprehension or extension. Often, I require an earlier answer to be used as part of a later answer, so an early error (generally failing to make the numbers make sense) has penalties in terms of understanding. I could change this, but decided that the point is worth making, that if you allow a wrong answer and follow it to other conclusions, all of the answers after the error are going to be wrong, though there are many clues that the later answers do not make sense. The idea that early answers are needed for later ones is a deliberate action; we do this is real life, building a case for a conclusion. Only at school do we separate problems so that we, in many ways, permit errors to occur. My intention is to encourage students to find ways to test that their answers make sense. Further than that, when an answer looks extreme, to find ways to test that their model is correct and that their conclusion has validity – validity, that is, within the assumptions made. Thus if a model produces a ridiculous answer, one of the possibilities is that the assumptions are wrong and therefore need adjustment. This, I think, is a useful life skill.
For example, in 'more trees' Q3 indicates 'a lot more than ten' as a hint that, if your solution does not fit that descriptor, you have slipped up. Q5 offers a clue to those that have dropped a factor of 100 or 1000. Surely it is obvious that, if we are to increase the level of woodland in England by a factor of four, then the required trees will not fit tidily onto Dartmoor. But a student who has confused hectares, kilo-hectares and square kilometres is likely to need a hint; they are, often, too close to the problem to see that they've moved into an error state.
I hope to turn this into a reasonable collection of problems.

Decisions occurred at COP26 on trees, and on methane. For the first time, fossil fuels were named and coal in particular must move to a position where we do not mine it for burning. What applies to coal also applies to oil and gas, bu tthe perception is that, somehow, coal is worse for the environment. There are many confusions: action to reduce atmospheric CO2 is somehow lumped with reduction of other greenhouse gases; gases generated by human action (anthropogenic gases) are sometimes separated (and sometimes not) from those that occur naturally. Many figures that were thrown around had lost the detail that explained what was meant. For example, what do you think that figure of 1.5º means?
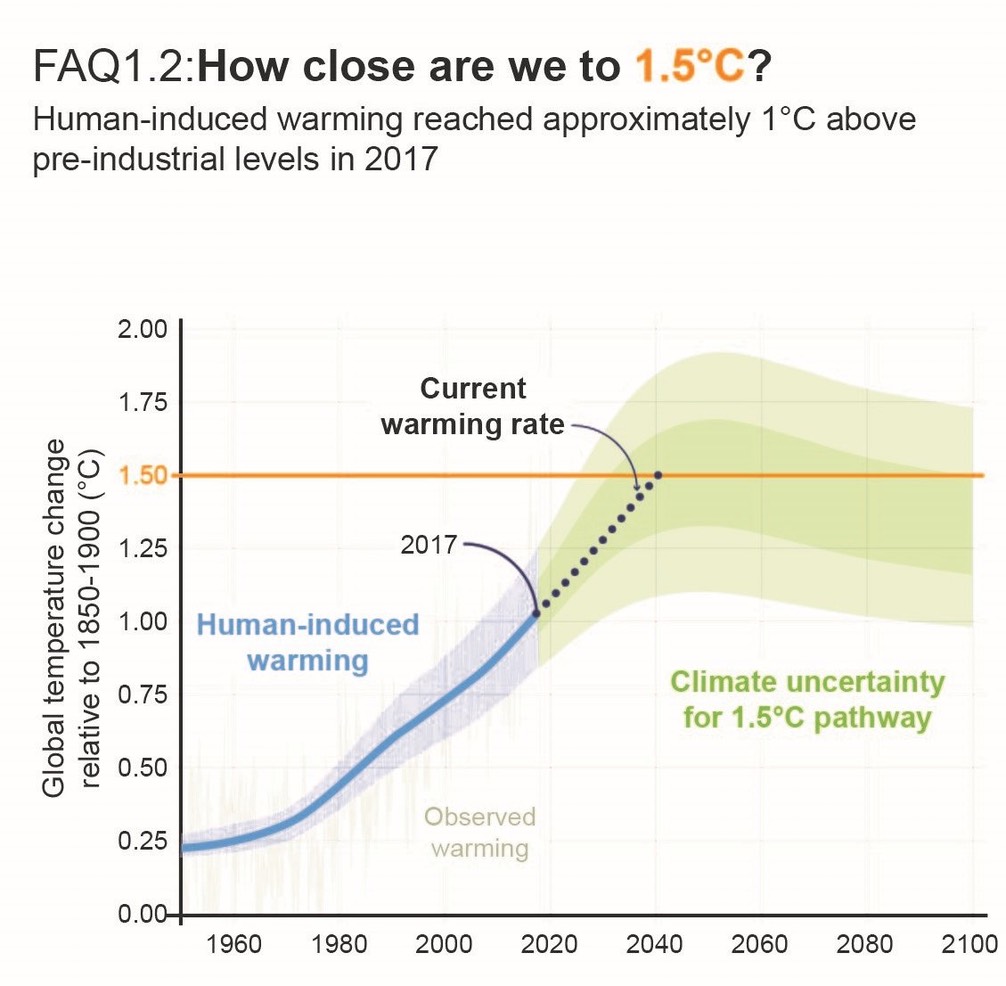
The target of 1.5ºC, which you will have heard bandied about such a lot, is a rise, but from what level? Just a little hunting shows that this is 'rise from pre-industrial levels'. Oh, and this is (mean) average global temperature, which must be quite difficult to work out. Funny, isn't it, how the important detail is so easily lost? In 2017 we had reached an increase of 1º rise. IPCC report FAQ. The point about the 1.5º figure is that any rise above that figure is modelled as having irreversible results. Turning that around, if we can keep the (average global temperature) rise below 1.5º, we have a chance of returning to pre-industrial levels of pollution (gas mixtures in the atmosphere) – in a sense, we can put the monster back in its cage, the genie back in the bottle, and other metaphors. If we fail to reach the 1.5º target, we also fail to prevent long-term changes. 'Pre-industrial' means 1850, or when the graph above left the notional x-axis. We might agree that, if the problem is perceived as greenhouse gases, and that it is our actions that have caused change, then it is around 1850 when we made dramatic changes in behaviour. Quite how we measured the average global temperature in 1850 is rarely explained. Again I point at the IPCC's FAQ.
DJS 20211116
my father's birthday, were he still here to celebrate such things.